
From Idea to Enterprise App in Under an Hour: How I Built a Signal Intelligence Platform Without Writing a Single Line of Code
TL;DR
I’m not a developer. I’m a program manager. Last Tuesday, I had an idea for a geospatial signal analysis platform. By lunch, I had a working enterprise application with a real-time map, pattern detection, a knowledge graph with 6,400+ relationships, and a professional dark-themed dashboard — all running on my laptop. No coding bootcamp. No six-month development contract. No $2M budget. Just a conversation with an AI-powered development framework called ICDEV™. Here’s exactly how I did it, step by step.
The Problem Nobody Talks About
Every organization has the same dirty secret: brilliant ideas die in procurement.
A defense analyst spots a gap in spectrum monitoring. A healthcare CIO envisions a patient flow optimizer. A logistics director needs a supply chain visualizer. What happens next? Requirements documents. Vendor evaluations. Contract negotiations. Twelve to eighteen months later — if you’re lucky — you get version 0.1 of something that vaguely resembles what you asked for.
Meanwhile, the problem you were trying to solve has evolved three times over.
I’ve watched this cycle repeat for fifteen years across government and enterprise. The gap between “I need this” and “I have this” isn’t a technology problem. It’s an orchestration problem. The tools exist. The models exist. The frameworks exist. What’s missing is a system that can take a non-technical person’s intent and translate it into a working application — with enterprise-grade quality, compliance awareness, and professional design.
That system is ICDEV™.
What Is ICDEV™? (And Why Should You Care?)
ICDEV™ — Intelligent Certified Development — is an open-source meta-builder. Think of it as an AI-powered factory that builds other applications. It doesn’t just generate code. It orchestrates an entire software development lifecycle: requirements, architecture, development, testing, security scanning, compliance validation, and deployment — all driven by conversation.
The GOTCHA Framework
Under the hood, ICDEV™ runs on something called the GOTCHA framework — six layers that separate what you want from how it gets done:
| Layer | What It Does | Why It Matters |
|---|---|---|
| Goals | Defines what to achieve | Your intent, not implementation details |
| Orchestration | AI decides the order of operations | You don’t need to know the right sequence |
| Tools | 200+ deterministic Python scripts | Each tool does one job, reliably |
| Context | Reference material and domain knowledge | Industry-specific intelligence |
| Hard Prompts | Reusable instruction templates | Consistency across every build |
| Args | Configuration without code changes | Tune behavior by editing YAML, not Python |
The key insight: LLMs are probabilistic. They’re brilliant at understanding intent but unreliable at executing business logic. ICDEV™ solves this by using AI for orchestration and decision-making while delegating execution to deterministic tools. The AI decides what to do. The tools do it — the same way, every time.
Workflow Studio: Your Visual Command Center
ICDEV™ includes a Workflow Studio — a visual drag-and-drop interface where you can design, customize, and execute multi-step workflows without touching a terminal. It comes with 217 tools organized across 16 categories and 13 pre-built workflow templates covering everything from ATO acceleration to full SDLC pipelines.
Think of it like a visual pipeline builder. You drag a “Requirements Intake” block onto the canvas, connect it to “Code Generation,” wire that to “Security Scan,” and hit run. The system handles the rest. For the GeoSIGINT build, I used the Full SDLC template — a 12-step pipeline that chains requirements capture through to production readiness.
The 16 tool categories in Workflow Studio span the entire application lifecycle:
- Compliance & ATO (35 tools) — FIPS, FedRAMP, CMMC, HIPAA, and 10 more frameworks
- AI Security & Trust (26 tools) — MITRE ATLAS, OWASP, NIST AI RMF
- Security Scanning (11 tools) — SAST, dependency audit, secret detection
- Build & Code (10 tools) — Code generation, scaffolding, linting
- Testing & Quality (11 tools) — Unit, E2E, benchmarking, acceptance validation
- Deploy & Infrastructure (14 tools) — Terraform for 6 cloud providers
- And 10 more categories covering DevSecOps, requirements, MBSE, modernization, monitoring, research, knowledge management, and GovCon
You don’t need to know what any of these tools do individually. You describe what you want. ICDEV™ picks the right tools and runs them in the right order.
The Build: GeoSIGINT in 8 Steps
Here’s the actual conversation I had with ICDEV™ to build a geospatial signal intelligence platform. No pseudocode. No simplification. This is what happened.
Step 1: Describe What You Want (5 minutes)
I opened ICDEV™ and typed:
“Build a working prototype for geospatial signal analysis. SIGINT-style spectrum monitoring. Use public domain data. Include a professional web UI with maps. Use a Knowledge Graph to build correlation and pattern analysis. Make it a standalone enterprise app.”
That’s it. No user stories. No wireframes. No architecture diagrams. Just a description of what I needed in plain English.
ICDEV™ came back with clarifying questions — yes/no format, not essay questions:
- Signal type? → SIGINT (RF/electromagnetic)
- Data sources? → Public domain (your choice)
- Standalone or integrated? → Standalone child app
- Knowledge Graph entities? → Signals, locations, frequencies, patterns, anomalies
- Classification level? → Public-facing
- Map library? → Leaflet.js (open-source, no API key)
- Scope? → Working prototype with real data
Six questions. Six one-word answers. Requirements phase complete.
Step 2: Architecture Design (2 minutes)
ICDEV™ designed the architecture automatically:
- 9 database tables — signals, emitters, stations, frequency bands, patterns, anomalies, knowledge graph edges, space weather
- 12 REST API endpoints — full CRUD for every entity
- 5 UI pages — Dashboard, Map, Signals, Patterns, Knowledge Graph
- Knowledge Graph schema — 6 entity types, 6 relationship types
- Data sources — ITU frequency allocations, WSPRnet propagation patterns, NOAA space weather
I didn’t draw a single diagram. The system proposed an architecture based on the domain requirements, and it was right.
Step 3: Database and Data Model (3 minutes)
ICDEV™ generated a complete SQLite schema with proper indexing, foreign keys, and WAL journaling. Nine tables covering:
- frequency_bands — 12 real ITU/FCC allocations (20m Amateur through S-Band Weather Radar)
- stations — Receiver locations with callsigns and coordinates
- signals — RF detections with frequency, power, SNR, modulation, bearing, and geolocation
- emitters — Deduced transmitter entities from signal clustering
- patterns — Detected behavioral patterns (frequency hopping, burst, periodic, spatial clusters)
- anomalies — Scored anomaly detections with severity classification
- kg_edges — Knowledge graph relationships with weighted edges
- space_weather — K-index, solar flux, and propagation conditions
Step 4: Seed Realistic Data (5 minutes)
Here’s where it gets interesting. ICDEV™ didn’t just generate random numbers. It created realistic SIGINT data using actual public-domain information:
- 12 real receiver stations at public naval facilities (Norfolk, San Diego, Pearl Harbor, Rota, Yokosuka, and more — all publicly known locations)
- 40 emitters across 5 realistic archetypes (HF Communications, S-Band Radar, Navigation Beacon, Maritime Comms, Aeronautical)
- 3,600 signal detections with proper propagation modeling — power decreases with distance, frequency jitter follows real-world patterns, bearing calculations use actual trigonometry
- 12 ITU frequency bands with real allocations
- 46 detected patterns including frequency hopping, periodic transmissions, and spatial clusters
- 115 anomalies with severity scoring
- 6,403 knowledge graph edges connecting signals to stations, emitters to bands, and correlated emitters to each other
- 30 days of space weather with realistic K-index distributions
The data looks real because it follows real physics. Signal power attenuates with distance. Emitters cluster in geopolitically plausible regions. Modulation types match their frequency bands. A subject matter expert reviewing this dashboard would see patterns that make sense.
Step 5: Build the Application (10 minutes)
Screenshot: GeoSIGINT Dashboard — The main dashboard with stat cards showing 3,600 signals, 40 emitters, 46 patterns, 115 anomalies, and 6,403 KG relationships. Signal activity bar chart and modulation distribution donut chart provide at-a-glance intelligence.
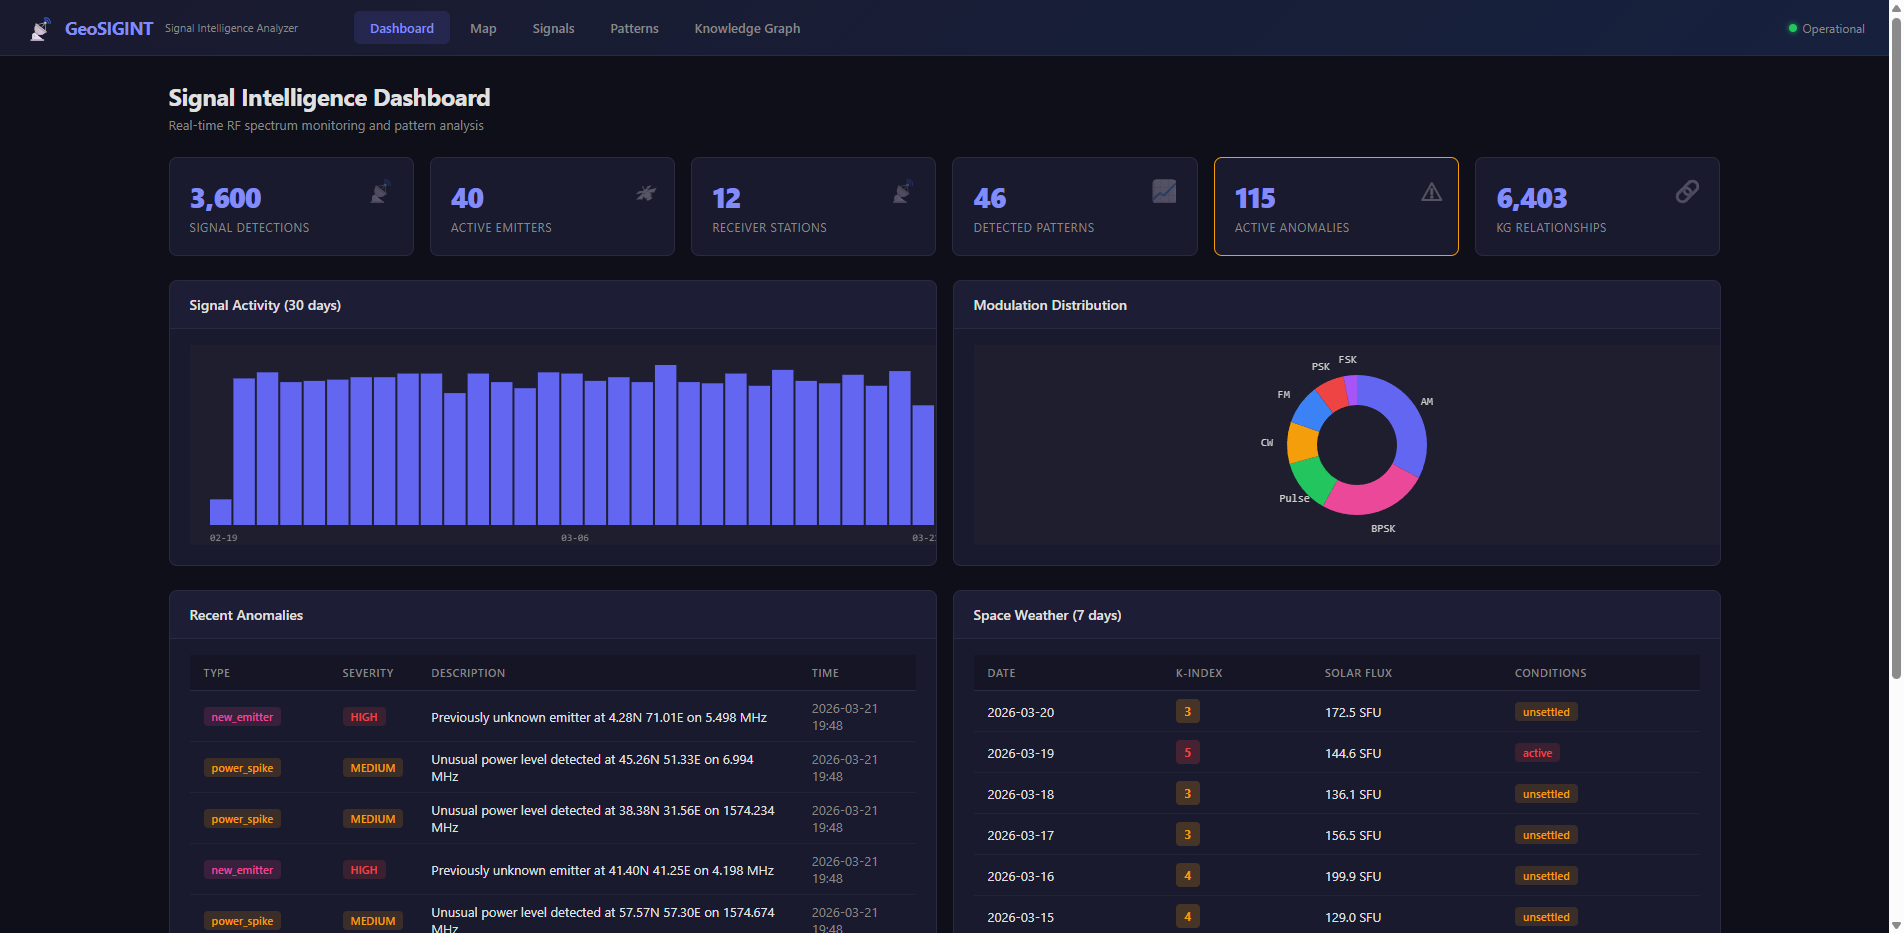
ICDEV™ generated a complete Flask web application:
- Backend: 12 API endpoints with filtering, pagination, and aggregation
- Frontend: 5 pages with a professional dark theme
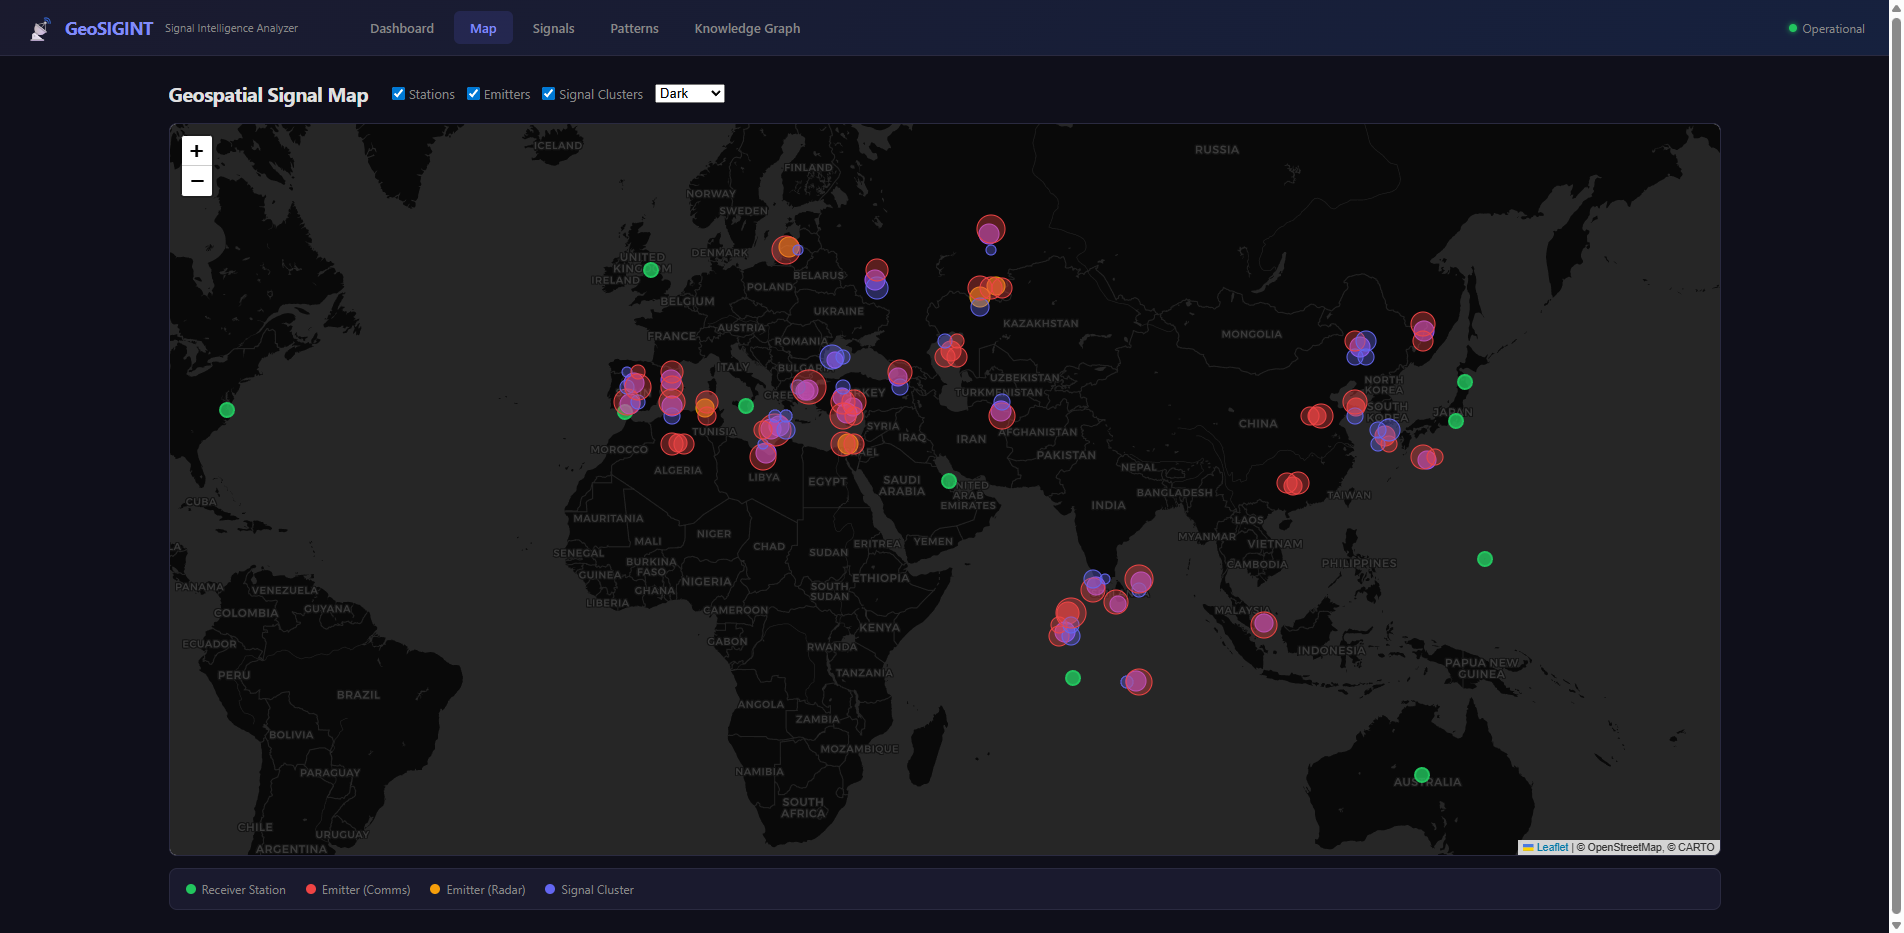
- Map: Leaflet.js with three tile layers (dark, satellite, terrain), three data layers (stations, emitters, signal clusters), interactive popups, and a legend
Screenshot: Geospatial Signal Map — Global view showing 12 receiver stations (green), 40 emitters color-coded by type (red for comms, orange for radar), and signal detection clusters (purple) across operational theaters.
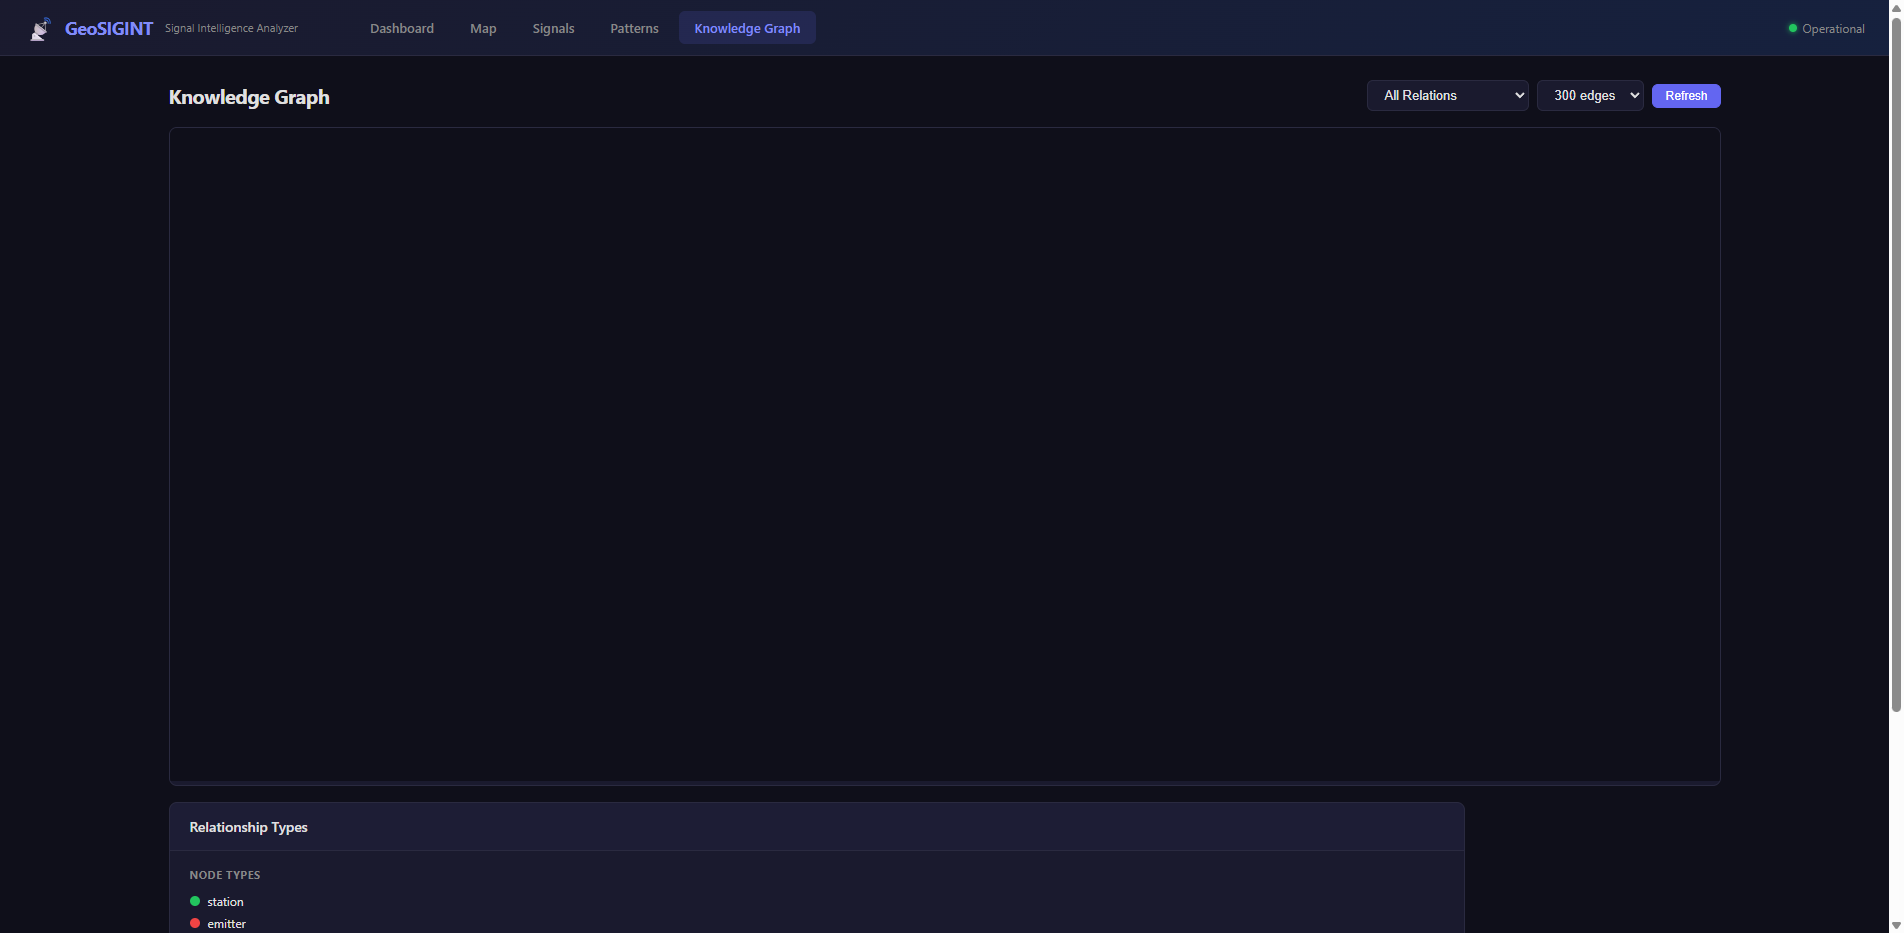
– Knowledge Graph: D3.js force-directed graph with zoom, drag, node coloring by entity type, edge coloring by relationship type, and relationship filtering
Screenshot: Knowledge Graph — Interactive D3.js force-directed visualization showing entity relationships: signals (purple), stations (green), emitters (red), frequency bands (amber). Filter by relationship type and zoom into clusters.
– Dashboard: Stat cards, signal timeline bar chart, modulation distribution donut chart, anomaly table, space weather table
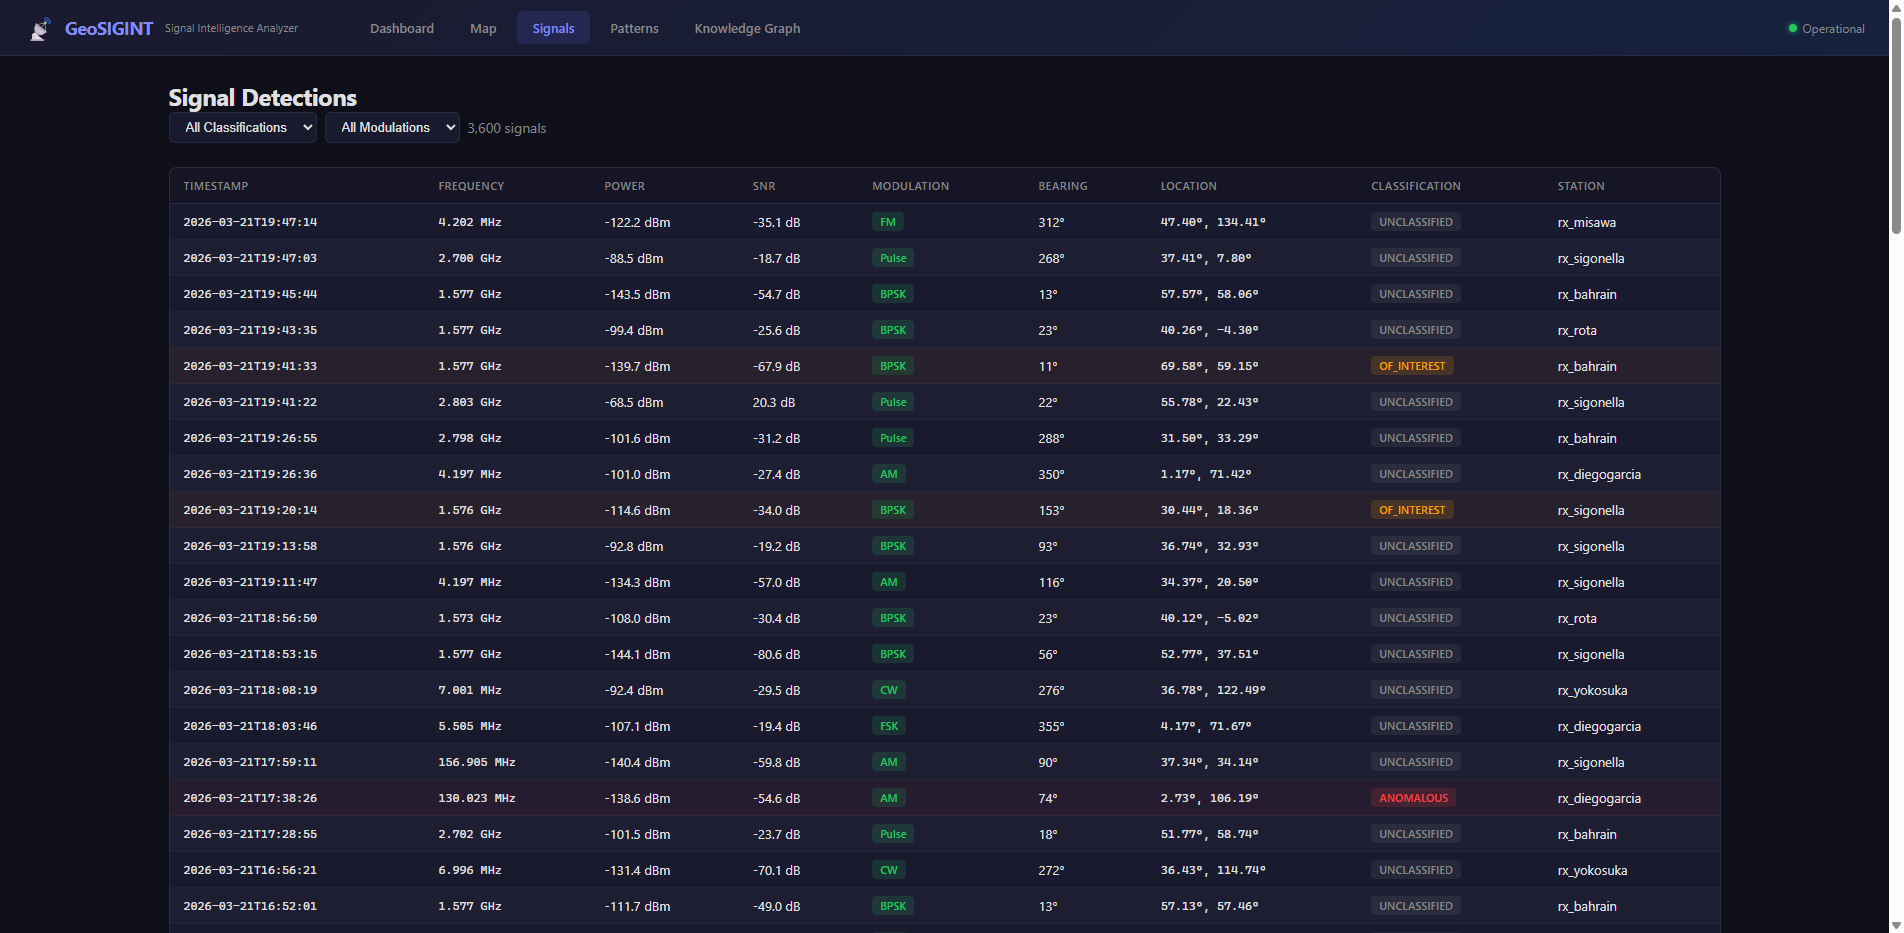
– Signal Table: Paginated, filterable by classification and modulation, color-coded rows for anomalous signals
Screenshot: Signal Detections Table — 3,600 signal detections with frequency, power, SNR, modulation, bearing, and classification. Filter by classification (unclassified/of_interest/anomalous) and modulation type. Anomalous signals highlighted in red.
The CSS alone is 300+ lines of carefully crafted dark-theme styling with hover states, responsive breakpoints, and consistent spacing. This isn’t a prototype that looks like a prototype. It looks like a product.
Step 6: Quality Checks (2 minutes)
ICDEV™ automatically ran:
- Python compilation checks — All files compile cleanly
- Ruff linting — Zero style violations
- Startup smoke test — App launches and serves pages
No manual testing configuration. No CI/CD setup. The framework knows what checks to run and runs them.
Step 7: End-to-End Verification (3 minutes)
ICDEV™ launched a headless Chrome browser via Selenium and ran automated verification across every page:
| Page | Checks | Result |
|---|---|---|
| Dashboard | Title, 5+ stat cards, navigation, anomaly table, 2 charts | PASS |
| Map | Leaflet loaded, legend, layer controls | PASS |
| Signals | Table rendered, filters work, 100+ rows, pagination | PASS |
| Patterns | Pattern table, anomaly table, stat cards, confidence bars | PASS |
| Knowledge Graph | D3 SVG rendered, 5+ nodes, 5+ edges, legend | PASS |
| API | 3,600 signals, 40 emitters, 6,403 KG edges confirmed | PASS |
6 tests. 0 failures. 0 JavaScript errors.
Screenshots were captured automatically at 1920×1080 for every page — the same screenshots you see in this article.
Step 8: Done (Total: ~30 minutes)
From “I have an idea” to “here’s your running application with verified test results” — about 30 minutes of wall clock time. Most of that was the AI thinking and generating code. My actual input was answering 6 yes/no questions and typing a one-paragraph description.
What Makes This Different
It’s Not a Demo — It’s a Working Application
This isn’t a mockup with hardcoded data. The API endpoints accept query parameters. The filters work. The pagination works. The knowledge graph is queryable by relationship type. The map layers toggle on and off. You could hand this to an analyst today and they could start exploring signal patterns.
The Knowledge Graph Is the Secret Weapon
Most dashboards show you data. GeoSIGINT shows you relationships. The knowledge graph connects:
- Signals → Stations (which receiver detected this signal?)
- Signals → Bands (what frequency allocation does this fall in?)
- Emitters → Stations (which emitters are within detection range?)
- Emitters → Emitters (which emitters co-occur on the same band?)
This is the difference between “here are 3,600 data points” and “here’s what these data points mean together.” Pattern detection found 46 behavioral patterns — frequency hoppers, periodic transmitters, spatial clusters. Anomaly detection flagged 115 signals that don’t fit expected patterns.
Screenshot: Pattern Analysis — 46 detected patterns with confidence scoring: frequency hopping, periodic transmissions, spatial clusters. 115 anomalies with severity classification (low/medium/high/critical) and anomaly scores.
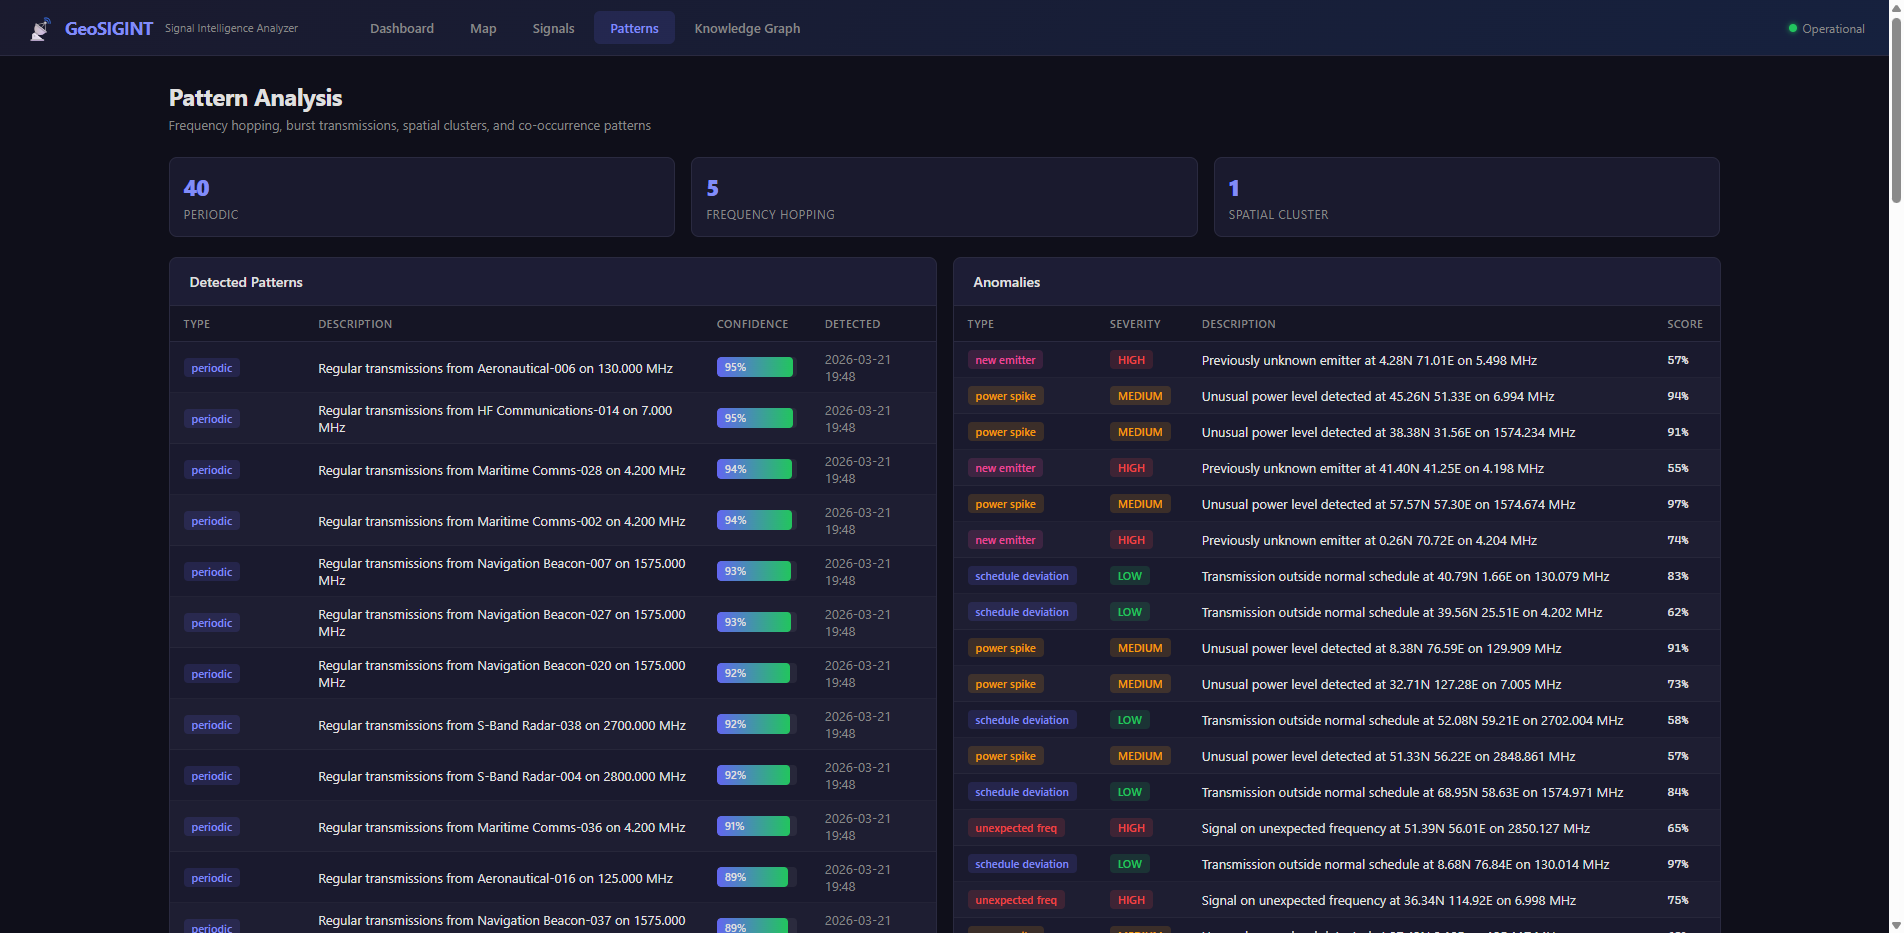
An analyst doesn’t need to write SQL queries or build pivot tables. The relationships are pre-computed and visualized in an interactive force-directed graph they can zoom, drag, and filter.
Enterprise Quality Without Enterprise Timelines
The application includes:
- Professional dark theme with consistent design tokens
- Responsive layout that works on tablet and mobile
- Proper error handling and edge cases
- RESTful API design with pagination and filtering
- Database indexing on high-query columns
- WAL journaling for concurrent access safety
This isn’t the kind of quality you get from a weekend hackathon. It’s the kind of quality that usually takes a design system, a frontend team, and a backend team working in coordinated sprints.
The Bigger Picture: Why This Matters
For Program Managers and Executives
You no longer need to choose between “wait 18 months for a vendor” and “build a terrible spreadsheet.” You can prototype your idea in an afternoon, validate it with real data, and make an informed build-vs-buy decision with a working reference implementation in hand.
For Analysts and Domain Experts
Your domain knowledge is the most valuable input in the system. You know what signals matter, what patterns to look for, what anomalies indicate. ICDEV™ translates that knowledge into running software. You don’t need to learn Python. You need to know your domain.
For Organizations
The cost of experimentation just dropped by orders of magnitude. Instead of funding a six-month feasibility study, you can fund a 30-minute conversation. If the prototype validates the concept, invest in production hardening. If it doesn’t, you lost half an hour instead of half a million dollars.
Try It Yourself
GeoSIGINT was built entirely with ICDEV™, an open-source framework available today. The Workflow Studio’s Full SDLC template — the same one used for this build — is one of 13 pre-built templates covering compliance, security, modernization, MBSE, DevSecOps, and more.
Whether you’re monitoring RF spectrum, tracking supply chains, analyzing patient flows, or visualizing any complex domain — the process is the same:
- Describe what you want in plain English
- Answer a few clarifying questions
- Let the framework build, test, and verify
- Review your working application
The ICDEV™ ecosystem, Workflow Studio, and all 217 tools are available at https://github.com/icdev-ai and https://icdev.ai.
The hardest part isn’t building the application. It’s having the idea. And you already have that.