
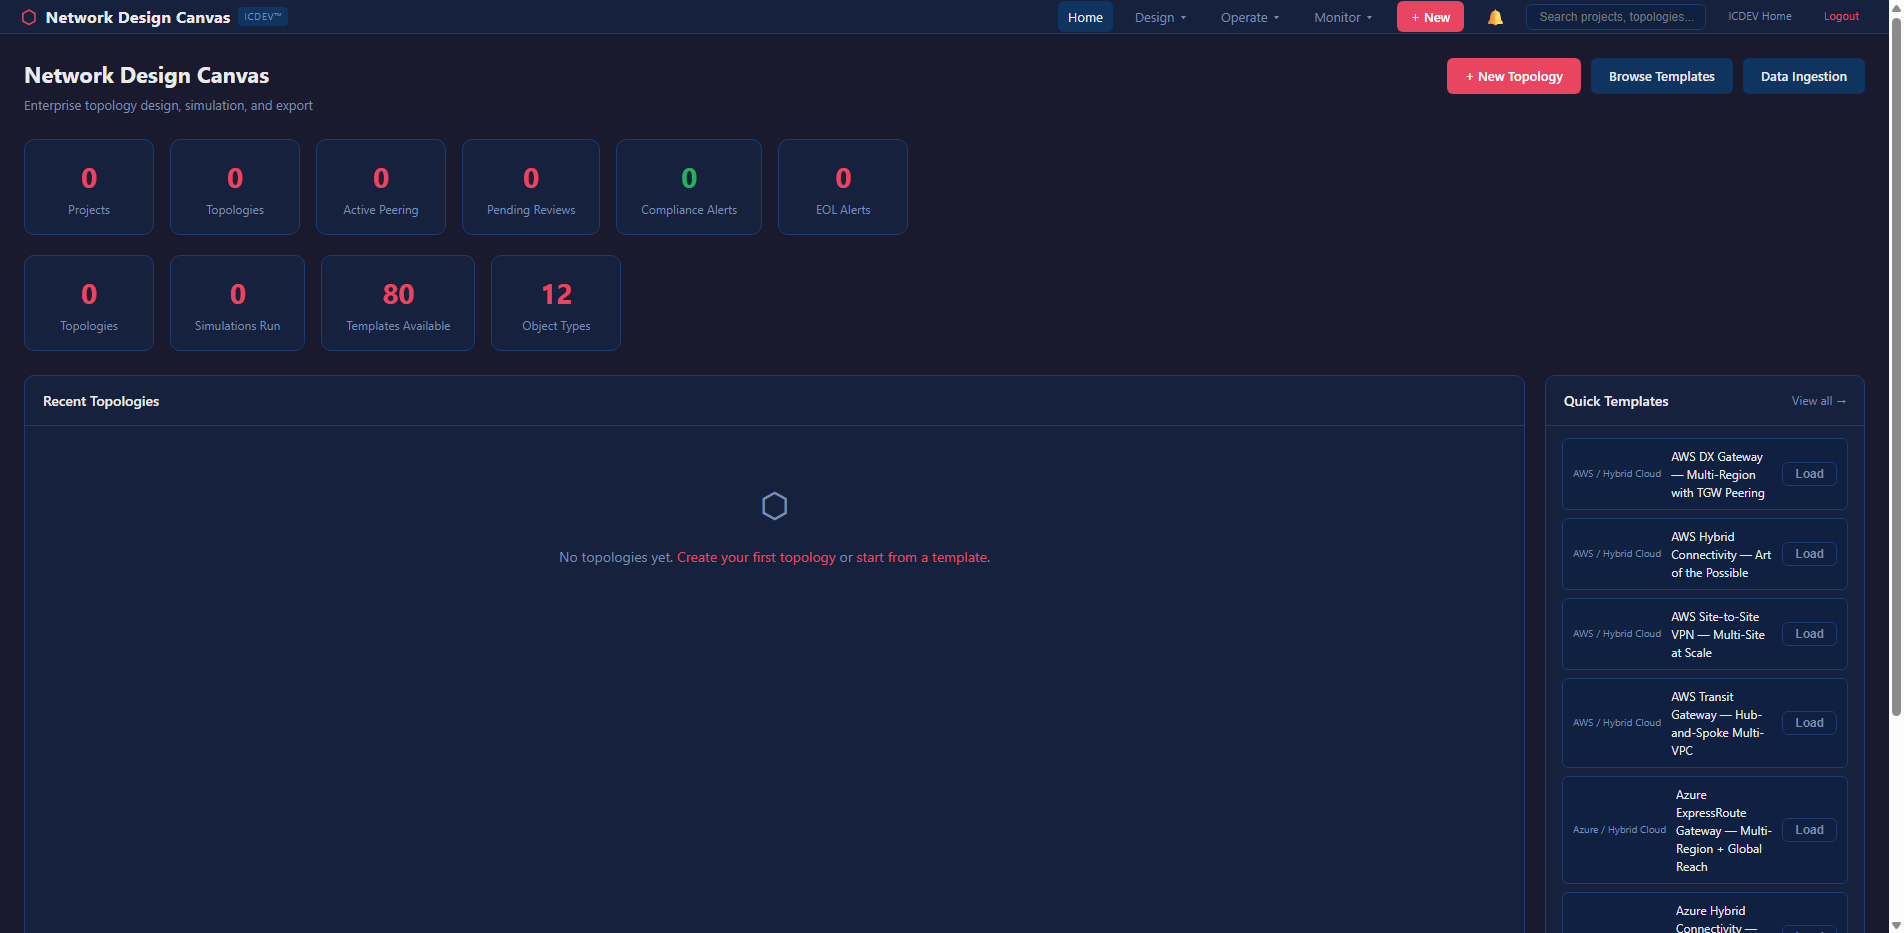
Your Network Diagrams Are Lying to You — How the Network Design Canvas Turns Static Topology Into Living Intelligence
TL;DR
Most network diagrams are snapshots frozen in time. They rot the moment someone swaps a switch or adds a VLAN. The Network Design Canvas (NDC) inside ICDEV flips this on its head — it ingests your existing Visio, Draw.io, or PDF diagrams, builds a knowledge graph from them, and then runs 13 analysis dimensions against the live topology: redundancy gaps, end-of-life risk, blast radius propagation, Monte Carlo resilience scoring, compliance audits against FISMA/STIG/Zero Trust, capacity projections, config drift detection, and more. All deterministic. Zero LLM in the hot path. You get an enterprise-grade network intelligence platform that speaks fluent NIST and generates Ansible playbooks, Terraform HCL, and device configs for Cisco IOS, Arista EOS, and Juniper JunOS — directly from the canvas. No more guessing which device takes down half the network when it fails.
Introduction
It starts the same way every time.
You’re onboarding to a new federal network — maybe a DoD enclave, maybe a civilian agency migrating to cloud. Someone hands you “the diagram.” It’s a Visio file from 2019. Half the devices on it have been replaced. The firewall cluster that’s supposed to be redundant? One unit failed eight months ago and nobody updated the drawing. The WAN link labeled “1 Gbps” was upgraded to 10G last quarter, but the diagram still shows the old capacity.
You ask the obvious question: “Is this accurate?”
Nobody knows.
This is the dirty secret of network engineering. The industry has spent billions on monitoring tools, SIEM platforms, and automation frameworks. But the foundational artifact — the network diagram — remains a static, unreliable picture that drifts from reality the moment someone saves it.
And that drift kills you. It kills you during incident response when you’re tracing a path that doesn’t exist anymore. It kills you during ATO assessments when the assessor asks to see your boundary diagram and you hand them fiction. It kills you during capacity planning when you’re modeling growth against links that were already upgraded.
The Network Design Canvas was built to fix this. Not by replacing your existing tools — but by making your diagrams intelligent.
The Problem Nobody Talks About
Network Diagrams Are Documentation Debt
Here’s a number that should make you uncomfortable: according to a 2024 EMA survey, 72% of enterprise network diagrams are outdated within 30 days of creation. In federal environments with strict change management processes, you’d expect better. You’d be wrong. The change management process captures the approval — it doesn’t update the Visio file.
The result is a growing gap between what your documentation says and what your network actually looks like. And in environments where an Authority to Operate depends on accurate system boundary documentation, that gap isn’t just an inconvenience. It’s a compliance risk.
Think about what a FISMA High assessor needs to see. They need your boundary diagram to match your SSP. They need every connection point documented. They need to verify that encryption exists at every boundary crossing. They need to confirm that redundancy claims in your contingency plan actually match the physical topology.
When your diagram is wrong, your SSP is wrong. When your SSP is wrong, your ATO is at risk.
The Spreadsheet Graveyard
Every network team has them. The spreadsheets. One for IP addresses. One for device inventory. One for circuit contracts. One for EOL tracking. One for port utilization. Maybe a SharePoint folder with config backups that are three months stale.
None of these talk to each other. None of them connect back to the diagram. When someone asks “which devices are past end-of-life and sit on a single point of failure?” — answering that question requires opening four different files and doing mental joins across spreadsheets that may or may not agree on device naming conventions.
This is the state of the art for most federal network teams. And it’s brutal.
Compliance Is a Moving Target
DISA releases STIG updates quarterly. NIST revises control baselines. Zero Trust architectures introduce new segmentation requirements that didn’t exist two years ago. CJIS adds encryption mandates. ICD 503 demands cross-domain controls for IC networks.
Every one of these changes potentially affects your network design. But there’s no automated way to ask: “Does my current topology comply with the latest STIG?” You’re back to the spreadsheet, back to the manual review, back to hoping the person who built the diagram remembered to mark which links are encrypted.
Enter the Network Design Canvas
The NDC isn’t a diagramming tool. It’s a network intelligence platform that happens to have a canvas.
The distinction matters. Tools like Visio and Draw.io are designed to create pictures. The NDC is designed to create a queryable knowledge graph from your network topology — and then run analysis against it. The diagram is the interface. The graph is the engine.
Ingestion: Start With What You Already Have
You don’t rebuild your network from scratch. You upload what you’ve got.
The NDC accepts Visio (.vsdx, .vdx), Draw.io (.drawio, .xml), PDF diagrams, and even raster images (PNG, JPG). For image files, it uses an OCR ensemble — Tesseract plus RapidOCR — with spatial inference to detect devices, links, and labels. No cloud vision API required. Air-gap safe.
Here’s what the ingestion config looks like:
ingestion:
  supported_formats: [".vsdx", ".vdx", ".drawio", ".xml", ".pdf", ".png", ".jpg", ".jpeg"]
  max_file_size_mb: 50
  ocr_fallback:
    enabled: true
    ensemble: true
    provider_chain: ["tesseract", "rapidocr"]
    spatial_inference:
      proximity_threshold_px: 300
      alignment_tolerance_px: 50
      min_confidence: 0.4
The ingestion pipeline parses your diagram into a normalized graph — nodes with types, labels, vendors, and metadata; edges with bandwidth, encryption status, and protocol. From there, every analysis dimension operates on the same graph structure.
The Canvas: Where Design Meets Intelligence
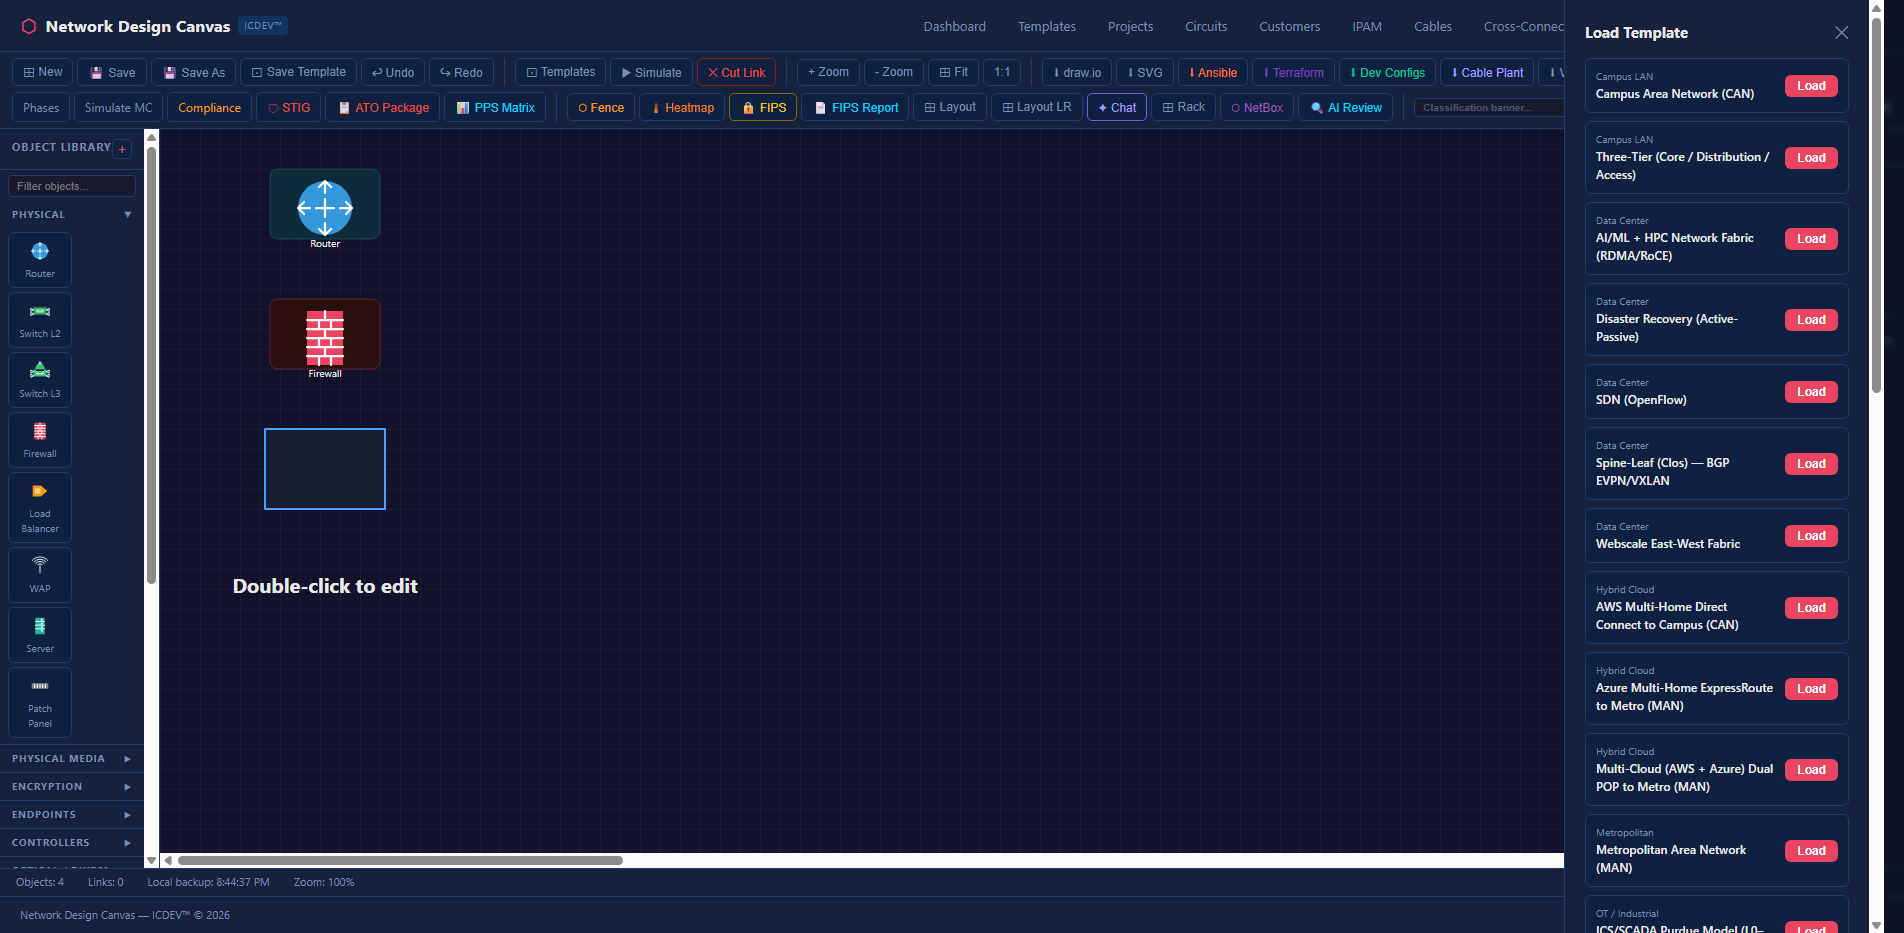
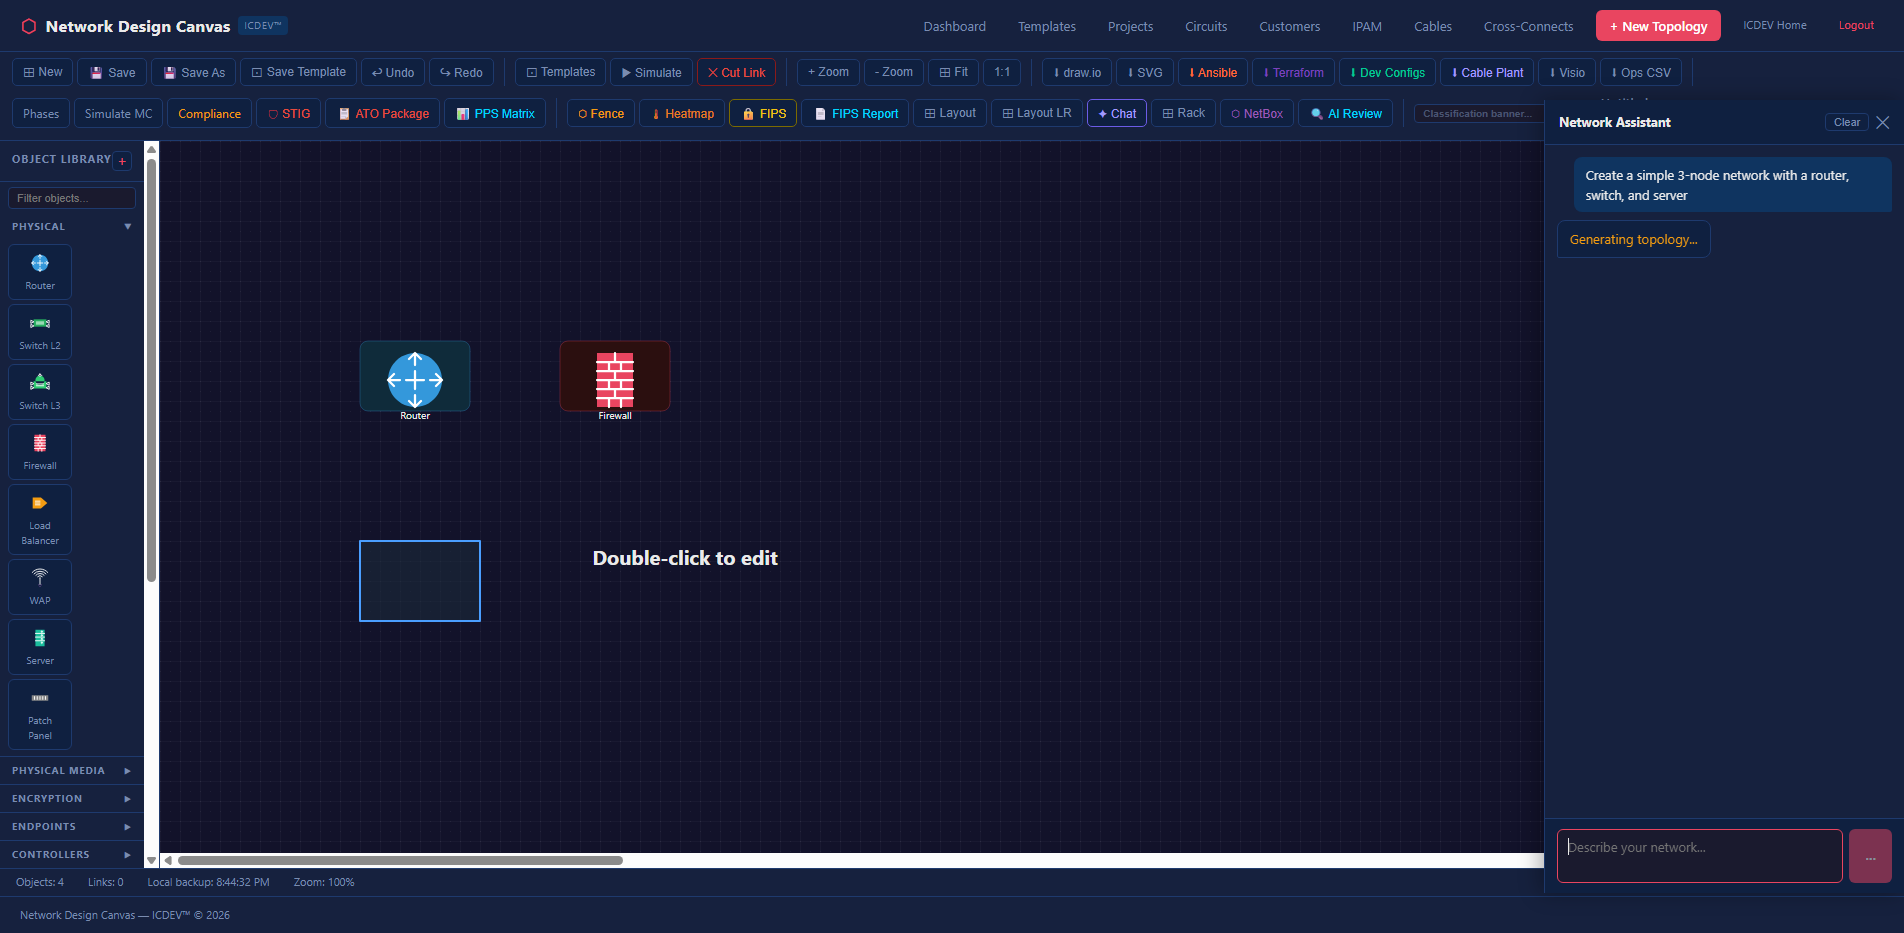
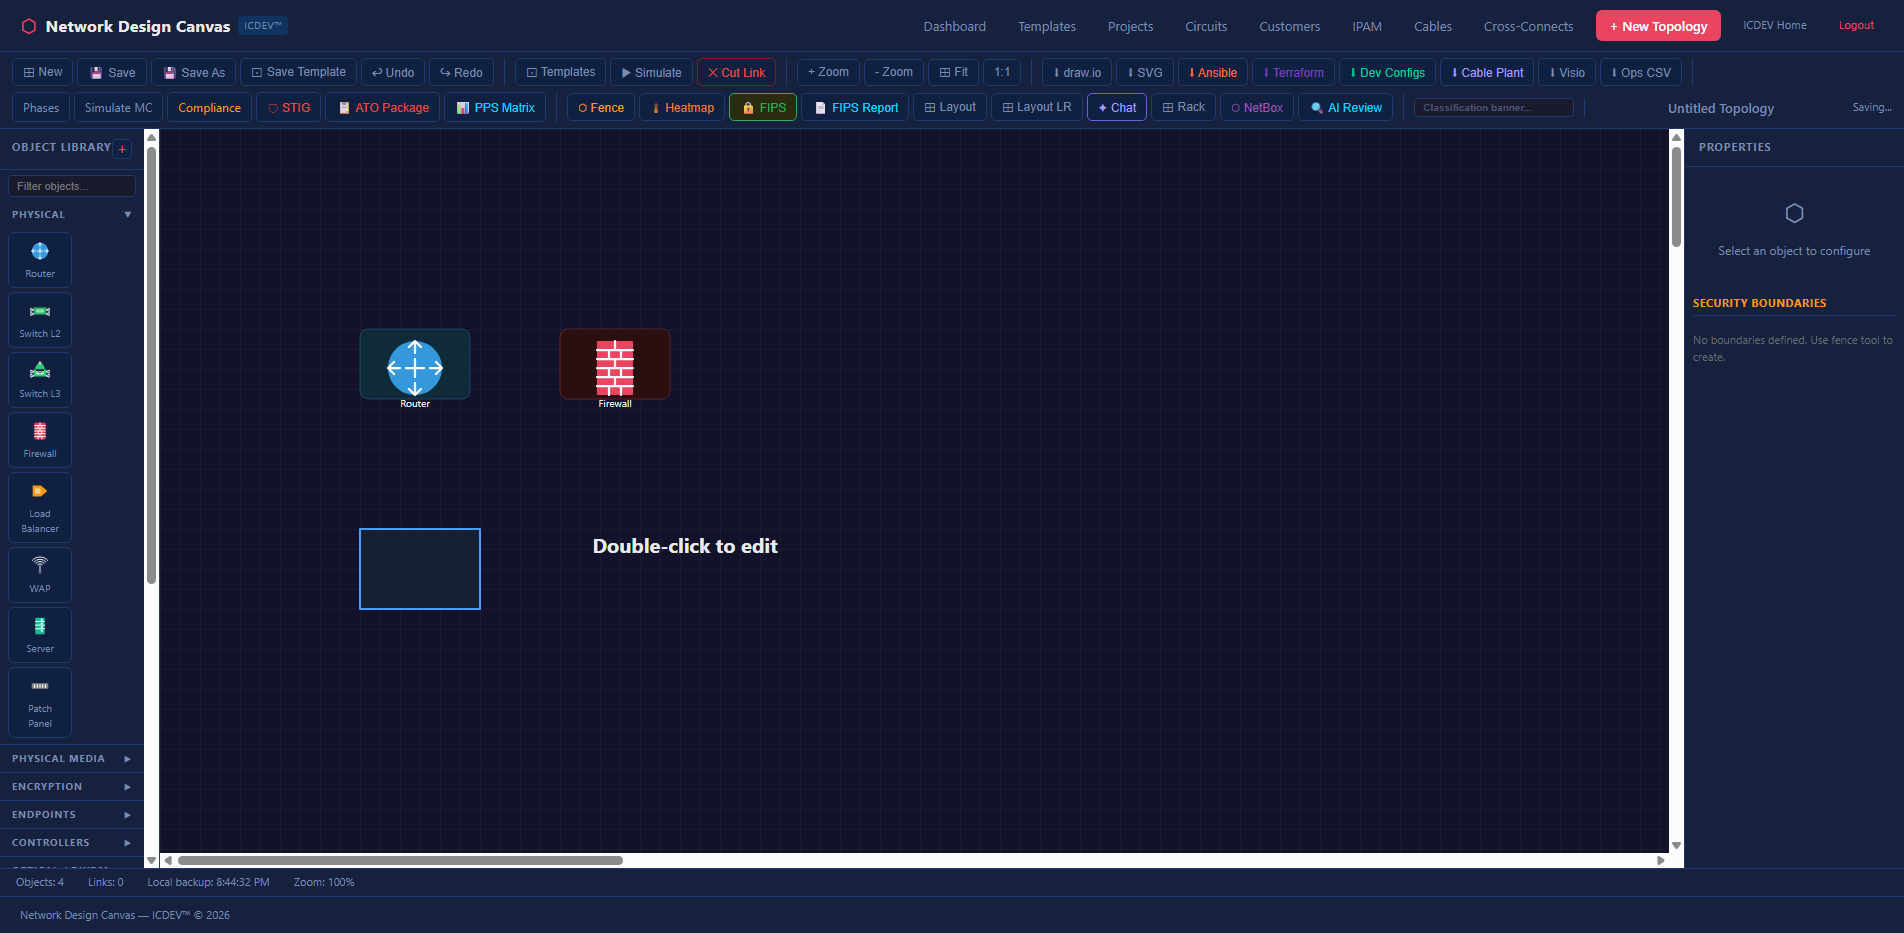
Once ingested, your topology lives on the interactive canvas. But this isn’t Visio.
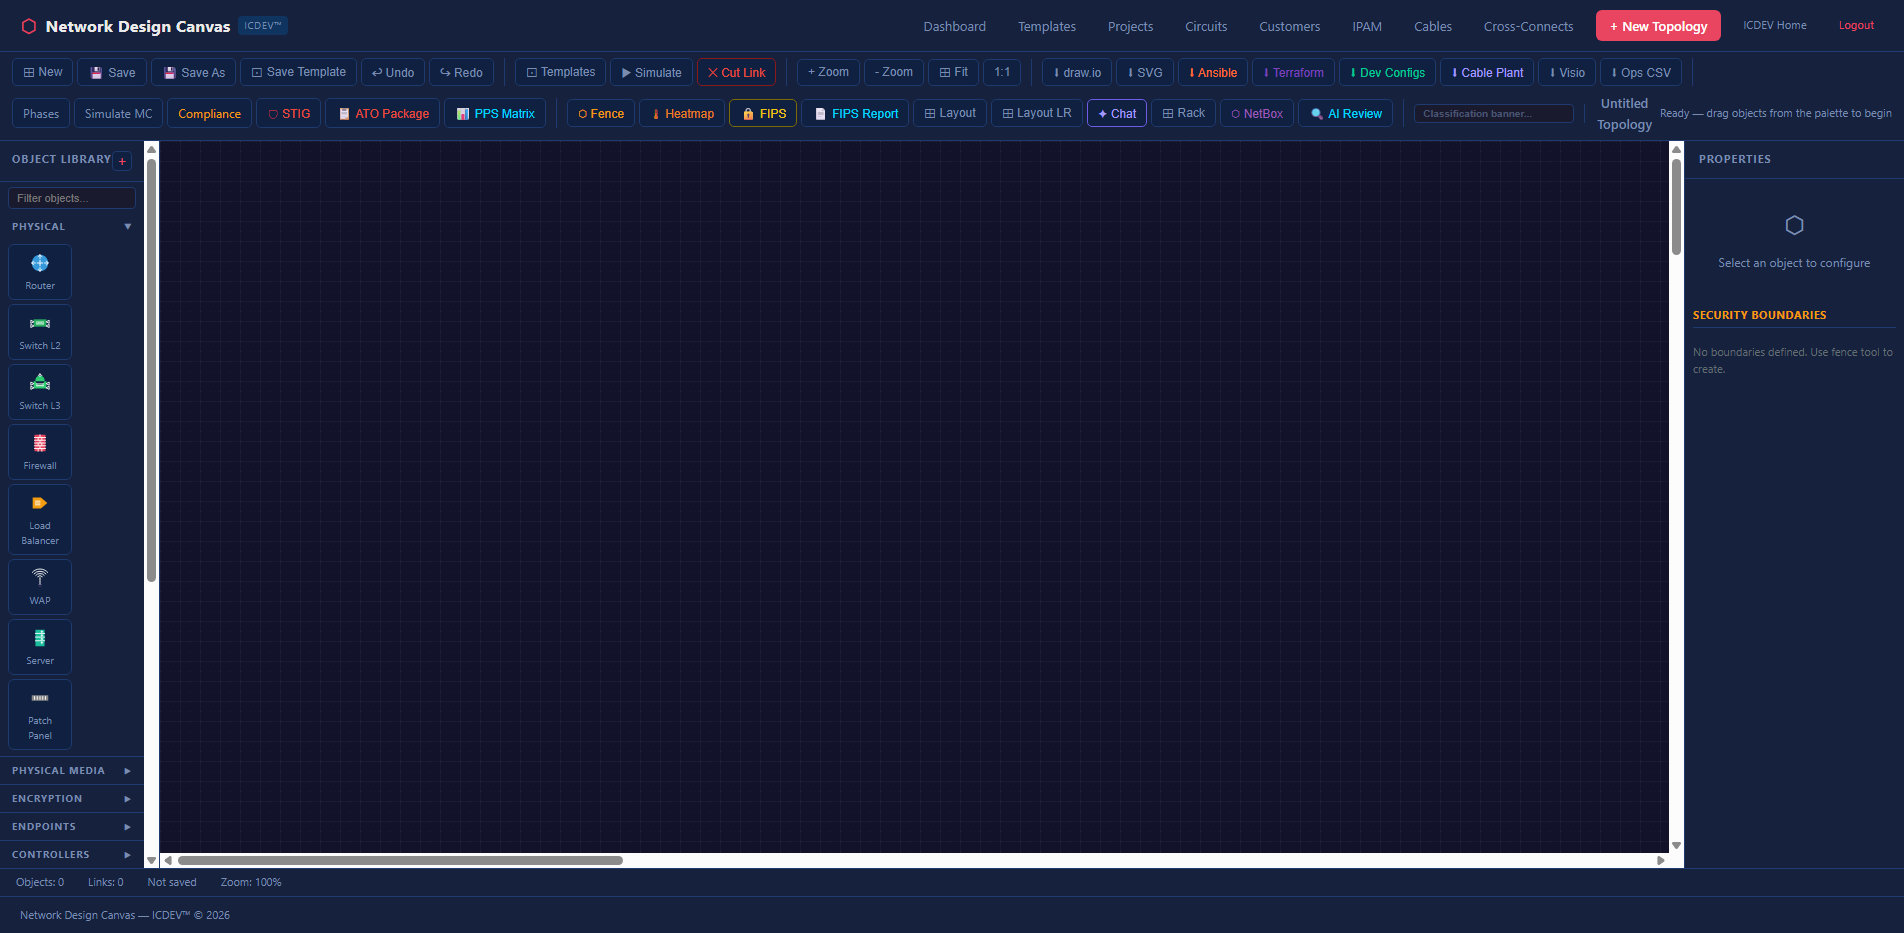
The toolbar gives you five groups of actions: file operations (new, save, save-as, undo, redo), design tools (templates, snippets, simulate, cut link), zoom controls, export options, and advanced features (phases, Monte Carlo, compliance audit, STIG import).
The export dropdown alone tells you this isn’t a typical diagramming tool:
- Draw.io — round-trip back to open-source editors
- SVG — vector graphics for documentation
- Visio (.vsdx) — because your stakeholders still use Visio
- Ops CSV — flat inventory export
- Ansible inventory — ready-to-run automation
- Terraform HCL — infrastructure-as-code
- Device Configs (IOS/EOS/JunOS) — actual router and switch configurations
- Cable Plant Report — physical layer documentation
That last group is what separates NDC from every other diagramming tool. You design your network, and the canvas generates the automation artifacts to build it. Not as a separate step. Not through a different tool. Directly from the topology graph.
The 13 Analysis Dimensions
This is where NDC earns its keep. Every topology you build or import can be analyzed across 13 dimensions — all deterministic, all pure Python, all running against the graph without any LLM in the critical path.
1. Redundancy Analysis — Finding Your Single Points of Failure
The redundancy engine uses Tarjan’s algorithm to find articulation points — nodes whose removal disconnects the graph. It also identifies bridge edges (links whose failure splits the network into isolated segments).
def _find_articulation_points(adj, nodes):
    """Find articulation points using Tarjan's algorithm (pure Python)."""
    visited, disc, low, parent, ap = set(), {}, {}, {}, set()
    timer = [0]

    def dfs(u):
        children = 0
        visited.add(u)
        disc[u] = low[u] = timer[0]
        timer[0] += 1
        for v in adj.get(u, set()):
            if v not in visited:
                children += 1
                parent[v] = u
                dfs(v)
                low[u] = min(low[u], low[v])
                if parent.get(u) is None and children > 1:
                    ap.add(u)
                if parent.get(u) is not None and low[v] >= disc[u]:
                    ap.add(u)
            elif v != parent.get(u):
                low[u] = min(low[u], disc[v])
    # ... runs DFS from every unvisited node
    return list(ap)
No NetworkX dependency. No graph library. Pure stdlib. This matters for air-gapped environments where installing packages is a procurement exercise.
The result tells you exactly which devices and links are unprotected — and what breaks if they go down.
2. End-of-Life Lifecycle Tracking
Every device has a lifespan. The EOL analyzer cross-references your topology against vendor lifecycle data and projects replacement costs using PERT distributions with configurable optimistic/pessimistic factors.
eol:
  default_replacement_cost_multiplier: 1.2
  maintenance_escalation_rate: 0.05  # 5% annual increase after EOL
It flags devices approaching or past EOL, calculates the maintenance cost escalation curve, and ranks replacement urgency by criticality. The output feeds directly into the Monte Carlo cost projections.
3. Blast Radius Propagation
When a core router fails, what goes down with it? The blast radius engine answers this using BFS (breadth-first search) with exponential decay. Each hop from the failed device reduces the impact score by a configurable decay factor.
# BFS with decay — each hop reduces impact
decay = 0.8  # configurable
queue = [(device_id, 1.0, 0)]  # (node, impact_score, hops)
while queue:
    current, impact, hops = queue.pop(0)
    next_impact = impact * decay
    for neighbor in adj.get(current, set()):
        if neighbor not in visited:
            queue.append((neighbor, next_impact, hops + 1))
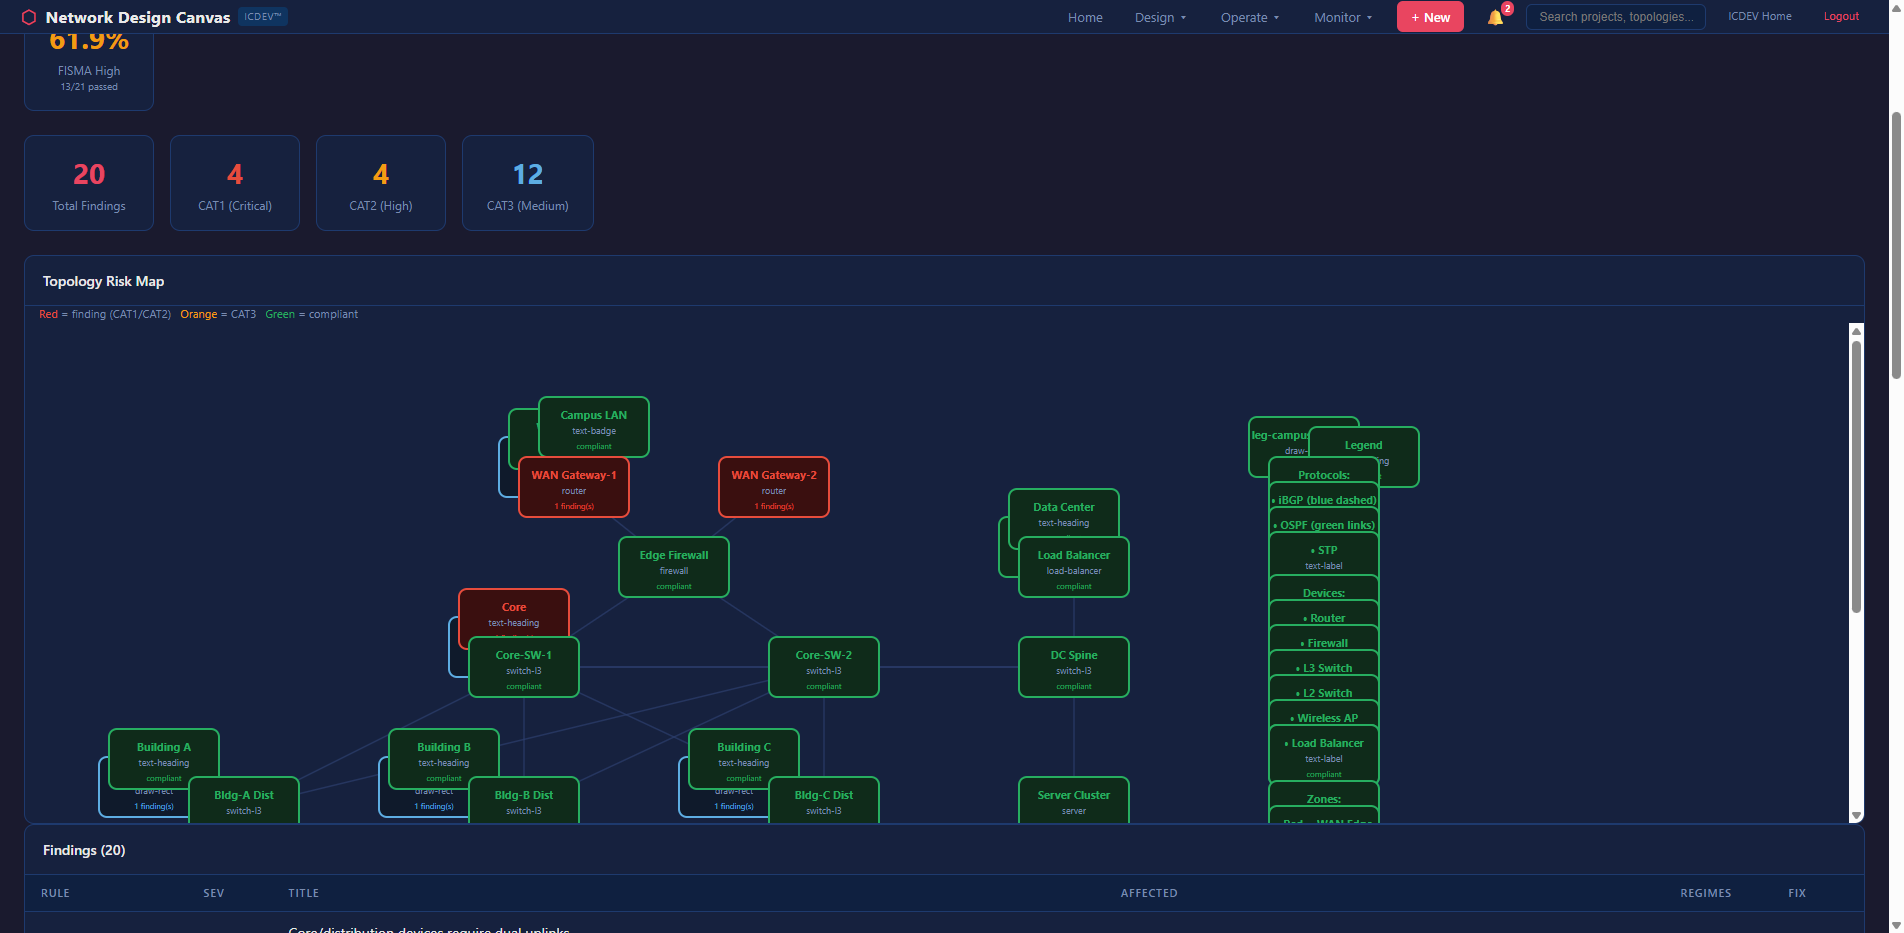
The result is a tiered impact map — RED (impact >= 0.8), ORANGE (>= 0.5), YELLOW (>= 0.2), GREEN (below threshold). The dashboard renders this as a topology risk heatmap where you can visually see the blast zone.
4. Change Impact Analysis
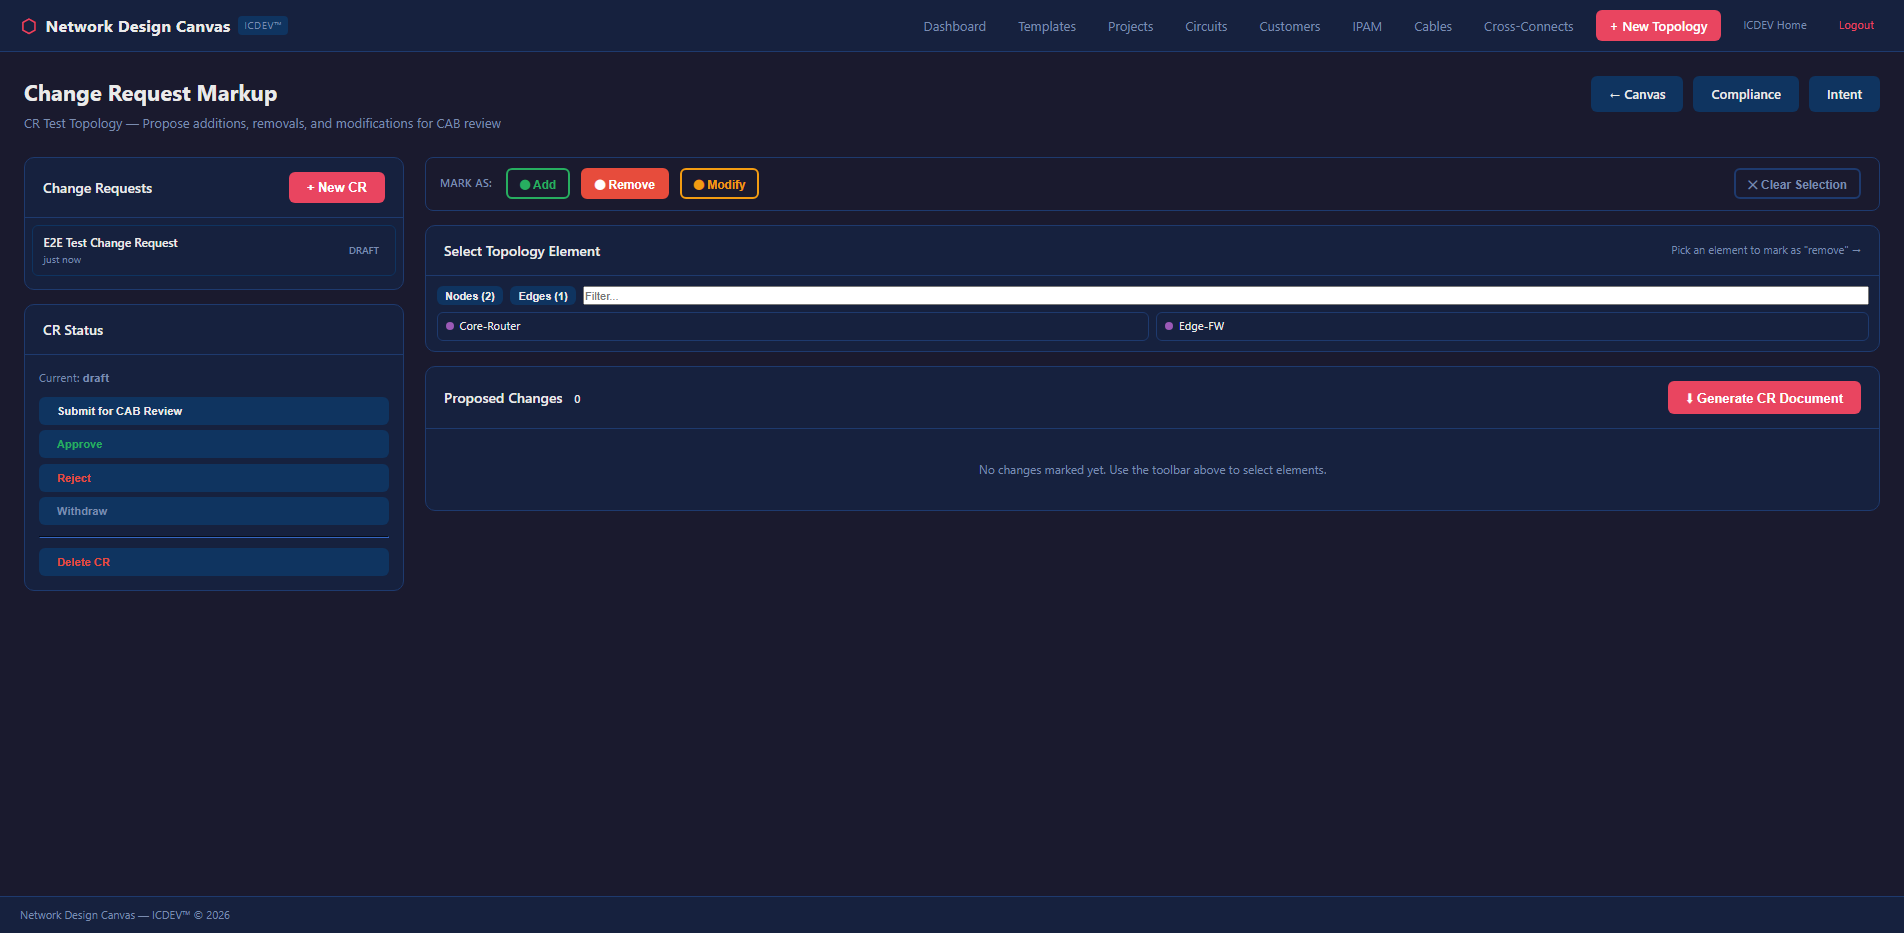
Before you make a change, simulate it. The change impact engine compares before/after topology states and surfaces what breaks, what improves, and what shifts risk. It integrates with the change request markup system — you annotate proposed changes directly on the canvas, and the engine evaluates them before anyone touches a device.
5. Monte Carlo Resilience Scoring
This is where it gets serious. The Monte Carlo engine runs thousands of failure simulations against your topology. Each iteration randomly fails nodes and edges based on configurable probability distributions, then measures reachability across the surviving graph.
def run_monte_carlo(graph, scenario_name, scenario_type, config, iterations=1000):
    """Run N iterations of random/named failures.
    Models traffic rerouting (OSPF/BGP reconvergence) and reachability impact.
    Returns risk score, confidence intervals, cascading effects, recommendations.
    """
    # Cloud-managed HA services get lower failure probability
    CLOUD_HA_TYPES = {
        "aws-tgw", "aws-dx-gw", "aws-nlb", "aws-gwlb",
        "az-vwan", "az-crosslb", "gcp-ncc", "oci-drg",
    }
    CLOUD_HA_FAIL_PROB = 0.001  # 99.9% SLA per iteration

    for _ in range(iterations):
        # Random or named failures
        failed_nodes, failed_edges = determine_failures(...)
        # Build surviving adjacency
        surv_adj = remove_failed_components(adj, failed_nodes, failed_edges)
        # BFS reachability from first surviving node
        reach_pct = compute_reachability(surv_adj, surviving_nodes)
        reachability_scores.append(reach_pct)
It’s cloud-aware — AWS Transit Gateways, Azure vWAN hubs, and GCP NCC hubs get a 99.9% SLA probability, not the generic device failure rate. The output includes a resilience score, P5/P50/P95 confidence intervals, and specific recommendations for improving survivability.
Three scenario types are supported:
– Random — stochastic failure across all components
– Named — specific device or link failures (e.g., “what if the NYC core router fails?”)
– Circuit Change — model the impact of adding or removing a WAN circuit
6. Cost Projection (5-Year TCO)
The cost engine uses PERT (Program Evaluation and Review Technique) distributions — the same method used in DoD program management — to project total cost of ownership. It factors in hardware replacement, maintenance escalation after EOL, licensing, and power/cooling.
analysis:
  pert_lambda: 4
  cost_optimistic_factor: 0.8
  cost_pessimistic_factor: 1.5
  monte_carlo_iterations: 5000
The projections aren’t single-point estimates. They’re probability distributions. You get optimistic, most-likely, and pessimistic scenarios — the same framework that DCSA and DoD acquisition programs use for cost estimates.
7. Capacity Planning and Bandwidth Simulation
How much headroom do you actually have? The capacity planner models demand against available bandwidth using service profiles — VDI, Teams, O365, and general traffic — with configurable sustained/peak ratios and concurrency factors.
capacity:
  service_profiles:
    vdi:
      sustained_mbps: 4.0
      peak_mbps: 8.0
      concurrent_pct: 0.8
    teams:
      sustained_mbps: 2.0
      peak_mbps: 4.0
      concurrent_pct: 0.3
The bandwidth simulator projects utilization year-over-year, flags links that will hit the 80% bottleneck threshold, and generates upgrade recommendations. It’s the difference between “we think we need more bandwidth” and “link NYC-DC1 will exceed 80% utilization in Q3 2027 at current growth rates.”
8. Configuration Management
The config engine handles the full lifecycle: ingest existing configs, diff against golden templates, generate new configs from the topology, and export Ansible playbooks for deployment.
def generate_device_configs(graph, topo_name):
    """Generate per-device config files from a topology graph.
    Returns dict mapping filename to config text.
    Supports: Cisco IOS, Arista EOS, Juniper JunOS.
    """
    for node in nodes:
        os_type = determine_os_type(node)  # ios_router, eos, junos
        ctx = _build_device_context(node, edges, node_map, topo_name, os_type)
        config_text = _render_config(ctx, os_type)
        configs[f"{ctx['hostname']}_{os_type}.txt"] = config_text
    return configs
The generated configs include interface definitions, routing protocol stubs, ACLs based on security zone assignments, and management plane configuration. They’re not production-ready out of the box — that’s intentional. The config generator creates the 80% that’s tedious and repetitive. Your engineers review and customize the remaining 20%.
Critical design decision: config push generates an Ansible playbook but does NOT auto-execute. There’s a human review gate. This isn’t a tool that pushes configs to production without someone looking at them.
9. Compliance Assessment
This is the one that federal network engineers have been waiting for.
The compliance engine audits your topology against seven regulatory frameworks simultaneously:
| Regime | Framework | Focus |
|---|---|---|
| FISMA High | NIST 800-53 Rev 5 | Federal security controls |
| DISA STIG | DoD STIG | Defense hardening |
| FIPS 140-2/3 | FIPS | Cryptographic validation |
| Zero Trust | NIST 800-207 | Segmentation and trust boundaries |
| CJIS | FBI CJIS 5.9.1 | Criminal justice data |
| ICD 503 | ODNI | Intelligence community |
| CNSS 1253 | CNSS | National security systems |

For each regime, the engine evaluates topology-level controls: Are boundary devices present (SC-7)? Is encryption enforced on all external links (SC-8)? Are there monitoring points for audit logging (AU-3)? Does the segmentation strategy satisfy zero trust principles?
The audit produces a scorecard per regime, a findings table with severity ratings (CAT I, CAT II, CAT III for STIGs), and a topology risk map that color-codes devices by compliance posture.
And it generates remediation plans. Not generic “fix this control” advice — specific, topology-aware recommendations like “add a redundant firewall between Zone A and Zone B to satisfy SC-7(5)” or “enable FIPS-validated encryption on the WAN link between NYC and DC1 to satisfy SC-8(1).”
10. Availability and SLA Calculation
The availability engine computes composite SLA across the topology using per-device availability figures and MTTR (Mean Time To Repair) values.
availability:
  default_device_availability:
    router: 0.9999       # 99.99% — 52 min/year downtime
    switch: 0.99995      # 99.995% — 26 min/year
    firewall: 0.9998     # 99.98% — 105 min/year
    wan_link: 0.999      # 99.9% — 8.7 hrs/year
  default_mttr_hours:
    router: 4
    switch: 2
    firewall: 4
    wan_link: 8
It calculates end-to-end availability for critical paths, identifies which component drags down the overall SLA, and quantifies the availability improvement from adding redundancy at specific points. When your SLA contract says 99.99% and your topology can only deliver 99.95%, this engine shows you exactly where the gap is.
11. Latency Engineering
The latency analyzer models hop-by-hop forwarding delays with per-device-type processing times and fiber propagation delays.
latency:
  device_forwarding_delay_ms:
    router: 0.5
    switch: 0.1
    firewall: 2.0
    vpn_gateway: 3.0
  link_propagation_us_per_km: 5.0
  thresholds:
    interactive_ms: 50
    voice_ms: 100
    vdi_ms: 150
It computes worst-case latency between any two points in the topology and flags paths that exceed application-specific thresholds. A 150ms path is fine for email. It’s death for VDI sessions.
12. Config Drift Detection
Running config versus golden config. The drift detector compares what’s actually on the device against what should be there, filtering out noise patterns (NTP clock-period updates, comment lines) and surfacing meaningful deviations.
config_management:
  diff_ignore_patterns:
    - "^!"
    - "^ntp clock-period"
    - "^end"
  golden_template_source: "generated"
13. Vendor Risk Analysis
How concentrated is your vendor exposure? The vendor risk analyzer measures vendor concentration across the topology and cross-references devices against known CVE databases.
vendor_risk:
  concentration_high_threshold_pct: 70
  concentration_medium_threshold_pct: 50
If 80% of your core infrastructure runs on a single vendor, you have a supply chain concentration risk. The analyzer quantifies it and recommends diversification strategies.
Pre-Built Templates: Don’t Start From Scratch
The NDC ships with a library of pre-built topology templates covering the architectures you’ll actually encounter in federal and enterprise environments.
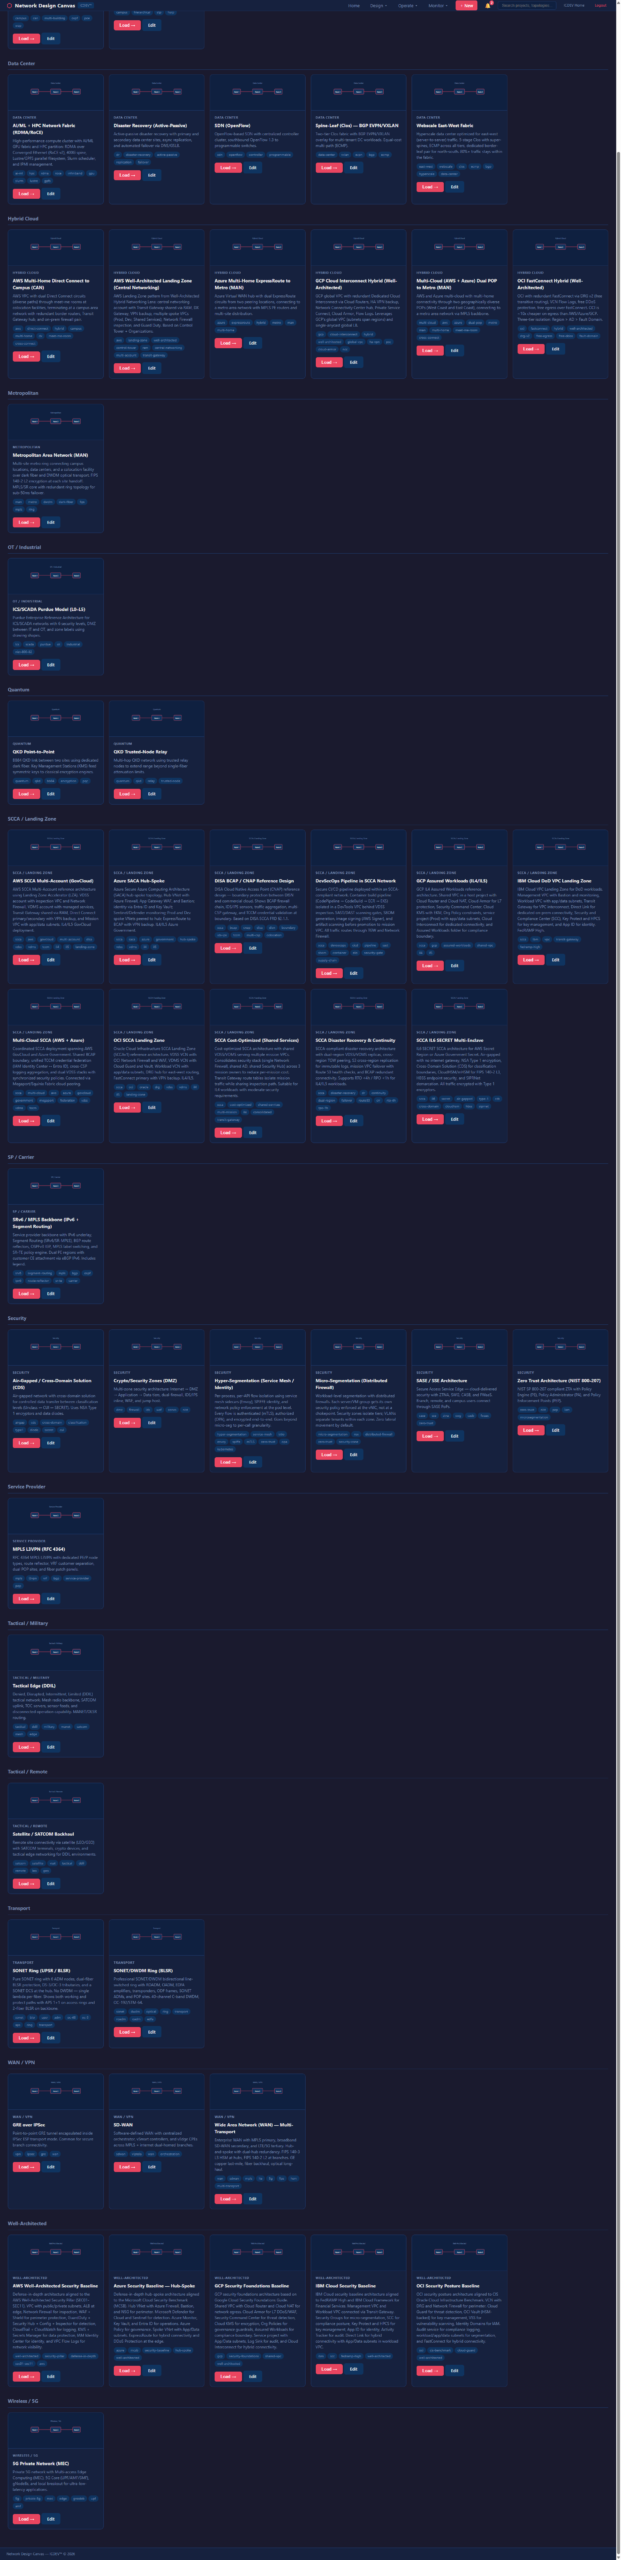
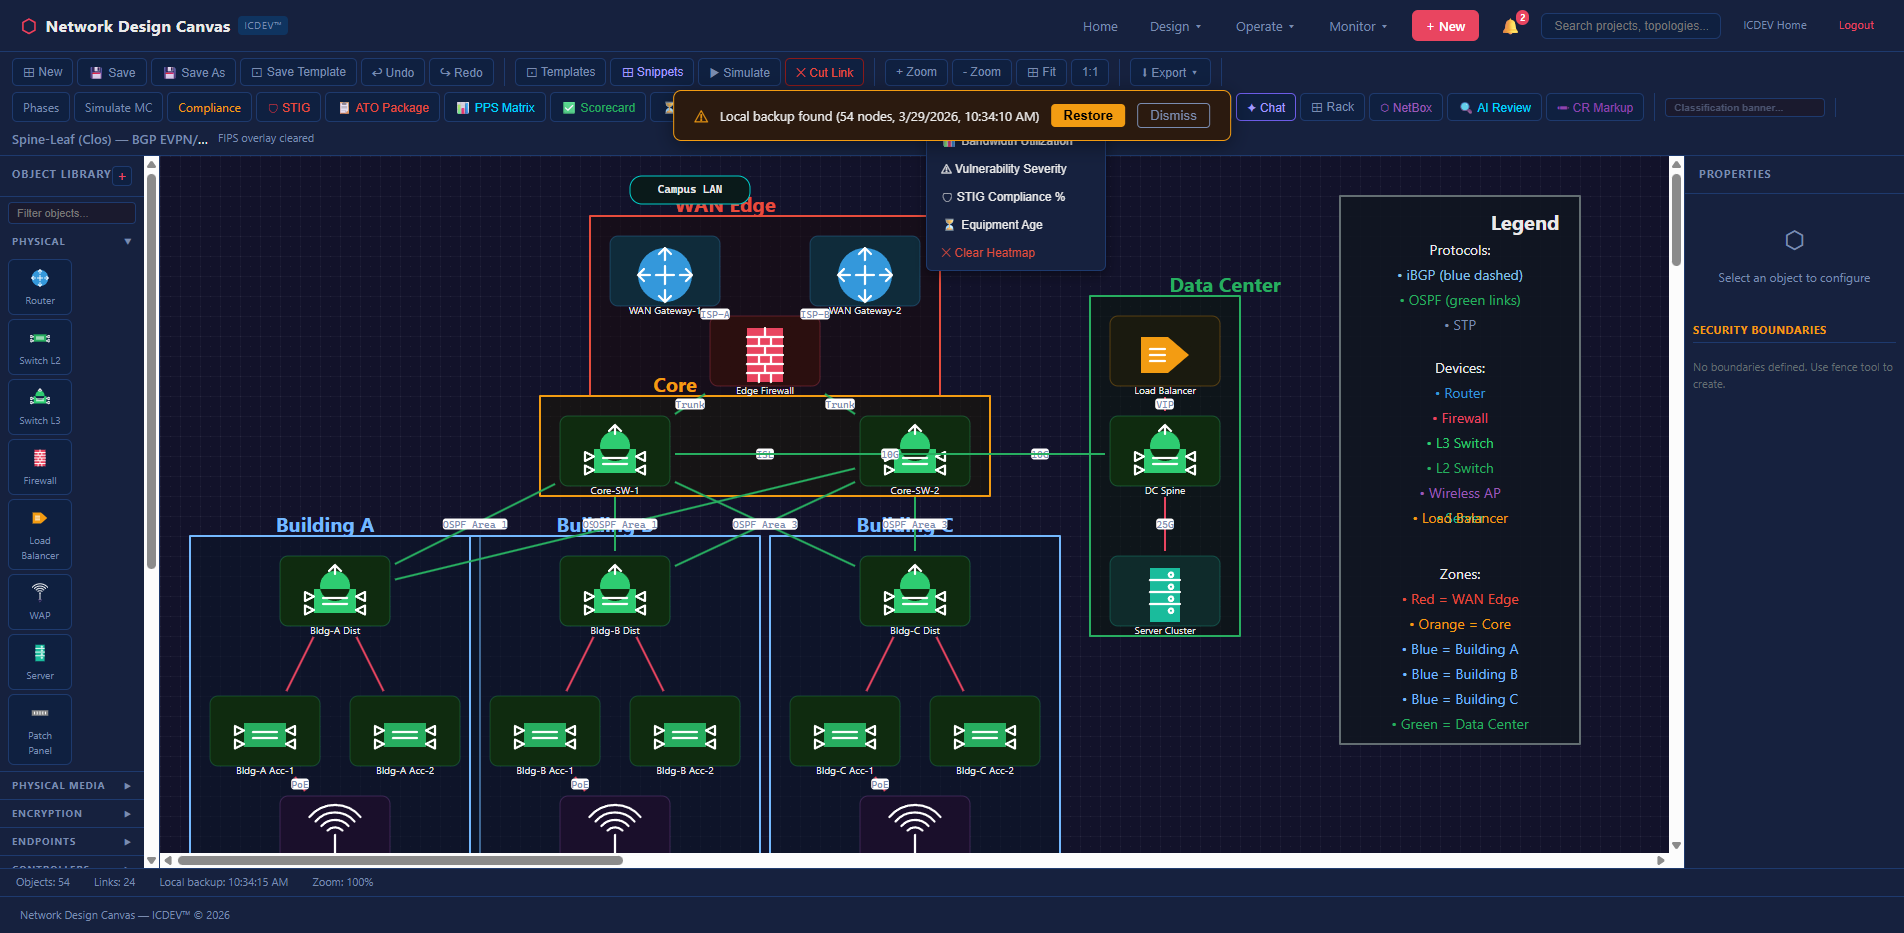
Enterprise Architectures
- Three-Tier — Classic access/distribution/core with redundant uplinks
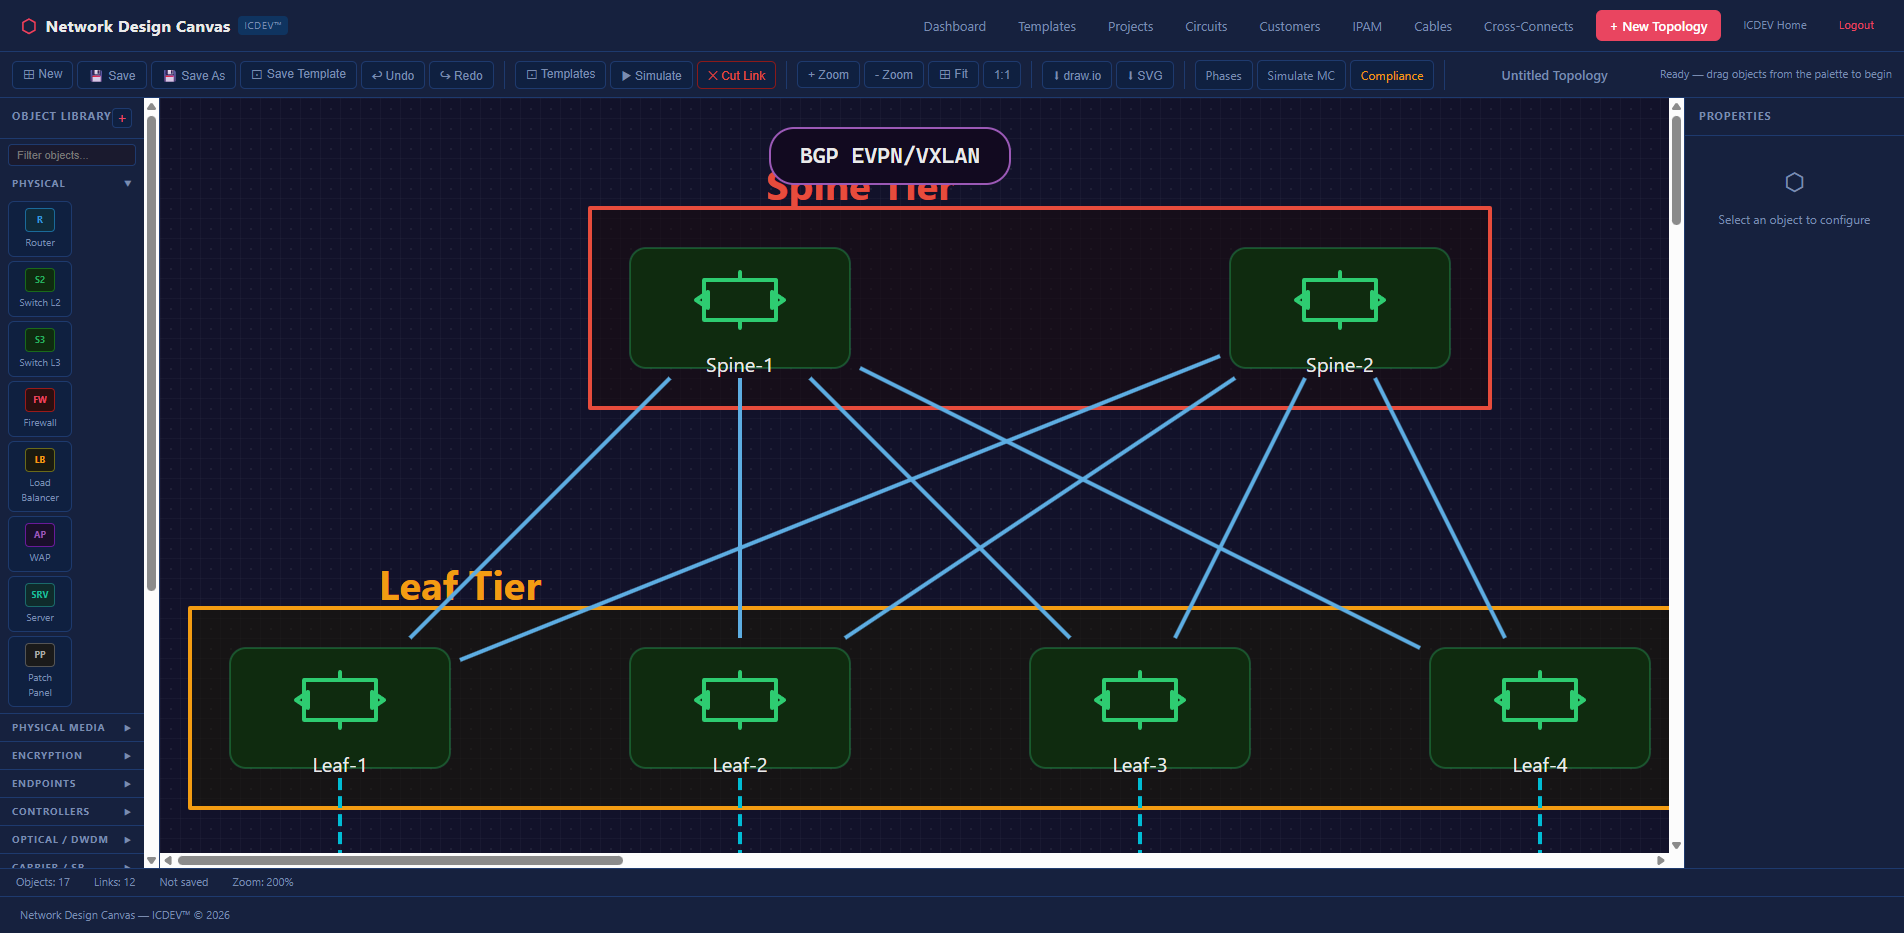
- Spine-Leaf — Modern datacenter fabric for east-west traffic
- AI/ML & HPC Cluster — GPU compute with high-bandwidth, low-latency interconnect
Security Architectures
- Security Zones (DMZ) — Traditional perimeter with inside/outside/DMZ segmentation
- ICS/Purdue Model — Industrial control system zones (Levels 0-5) for OT networks
- GRE/IPSec with Zones — Encrypted tunnel overlays with security zone enforcement
Cloud & Hybrid
- AWS Direct Connect — Hybrid connectivity with transit gateway and Direct Connect
- Multi-Cloud — Cross-CSP connectivity (AWS, Azure, GCP) with unified management
- SCCA (Secure Cloud Computing Architecture) — DoD cloud boundary architecture
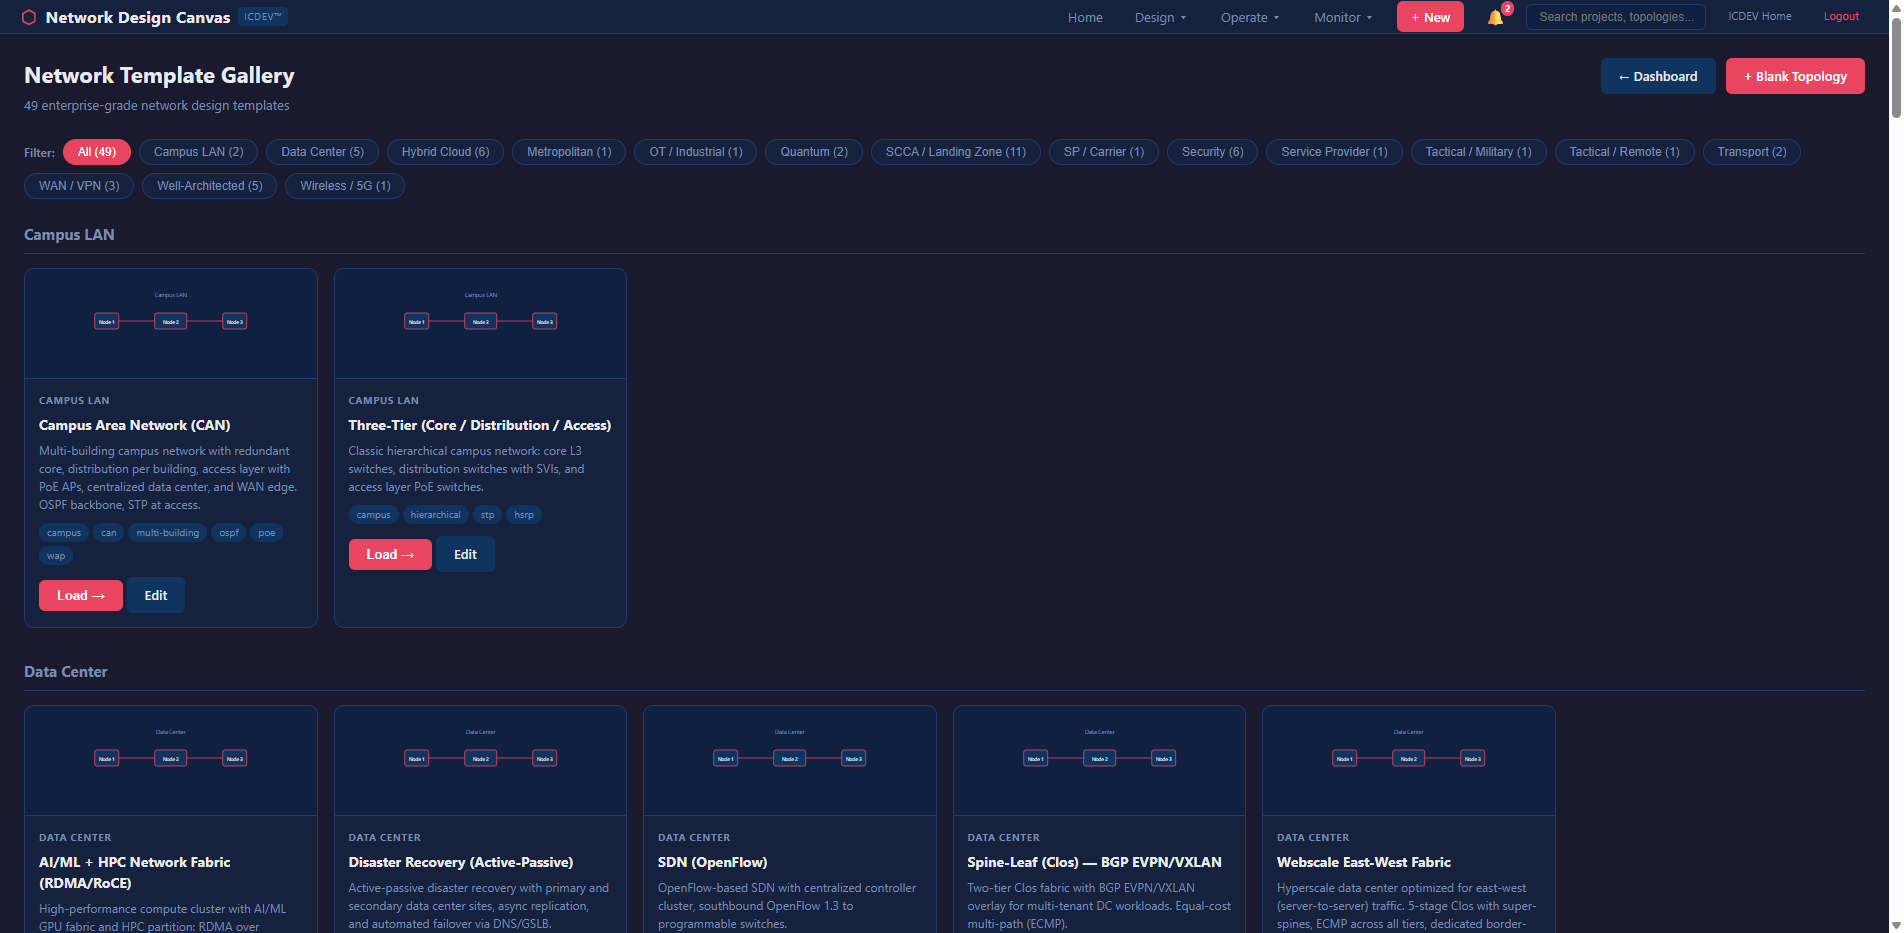
Each template isn’t just a picture. It’s a fully wired graph with typed nodes, labeled links, bandwidth specifications, and security zone assignments. Load a template, customize it for your environment, and every analysis dimension works immediately.
Enclave-in-a-Box Snippets
Beyond full templates, the NDC offers snippets — reusable sub-topologies you can drag onto the canvas. Need to add a standard DMZ pattern to an existing design? Drop in the DMZ snippet. Adding a VPN concentrator cluster? There’s a snippet for that. Building an ICS/SCADA security zone boundary? Snippet.
The concept borrows from software engineering’s component model. You don’t write a TCP stack every time you build an application. You shouldn’t wire a redundant firewall pair every time you design a security boundary. Snippets encode best practices into reusable graph fragments — nodes pre-typed, links pre-labeled, security zones pre-assigned.
And they compose. Drag a DMZ snippet onto a three-tier template. Connect the edges. The graph merges. Every analysis dimension immediately accounts for the new components. No manual reconfiguration. No “did I remember to update the redundancy model?” The graph is the model.
Natural Language Queries
Don’t want to click through 13 analysis panels? Ask a question in plain English.
The NDC includes a natural language query router that dispatches questions to the appropriate analysis engine. Type “Do I need a redundant link in NYC?” and the router invokes the redundancy analyzer scoped to the NYC site. Ask “What’s my blast radius if the core firewall fails?” and it runs the BFS propagation engine for that specific device. “Show me devices past end-of-life on single points of failure” — that’s a join across the EOL analyzer and the redundancy engine, executed automatically.
The query router uses scanner-tier LLM (qwen3.5, running locally on Ollama) for intent classification — zero cloud API cost, zero data exfiltration risk. The analysis itself remains fully deterministic. The LLM decides which engine to call. The engine does the math. This separation matters for classified environments: the intelligence logic runs entirely in pure Python, and the LLM component is optional, local, and air-gap safe.
You can also chain queries. “Run a compliance audit, then show me which findings overlap with my redundancy gaps.” The router dispatches both analyses and correlates the results. The chat panel on the canvas gives you conversational access to the full analysis stack without leaving the design view.
The API Layer
Everything on the dashboard is backed by a REST API with 16 endpoints. This matters because the NDC isn’t a walled garden — every analysis can be triggered programmatically.
POST /api/network-intelligence/ingest              # Upload diagram
GET  /api/network-intelligence/devices/<tid>        # Device inventory
POST /api/network-intelligence/query                # NL query
POST /api/network-intelligence/redundancy/<tid>     # Redundancy
POST /api/network-intelligence/eol/<tid>            # EOL lifecycle
POST /api/network-intelligence/blast-radius/<tid>/<did>  # Blast radius
POST /api/network-intelligence/impact/<tid>         # Change impact
POST /api/network-intelligence/capacity/<tid>       # Capacity planning
POST /api/network-intelligence/config/<tid>         # Config management
POST /api/network-intelligence/compliance/<tid>     # Compliance audit
GET  /api/network-intelligence/availability/<tid>   # SLA calculation
GET  /api/network-intelligence/latency/<tid>        # Latency modeling
GET  /api/network-intelligence/vendor-risk/<tid>    # Vendor risk
GET  /api/network-intelligence/circuits/<tid>       # Circuit inventory
POST /api/network-intelligence/cost-projection/<tid> # TCO projection
GET  /api/network-intelligence/analyses/<tid>       # Cached results
Want to run a compliance audit from your CI/CD pipeline after a topology change? Hit the endpoint. Want to integrate blast radius analysis into your change management ticketing system? Call the API. The canvas is one consumer of these endpoints. Your automation can be another.
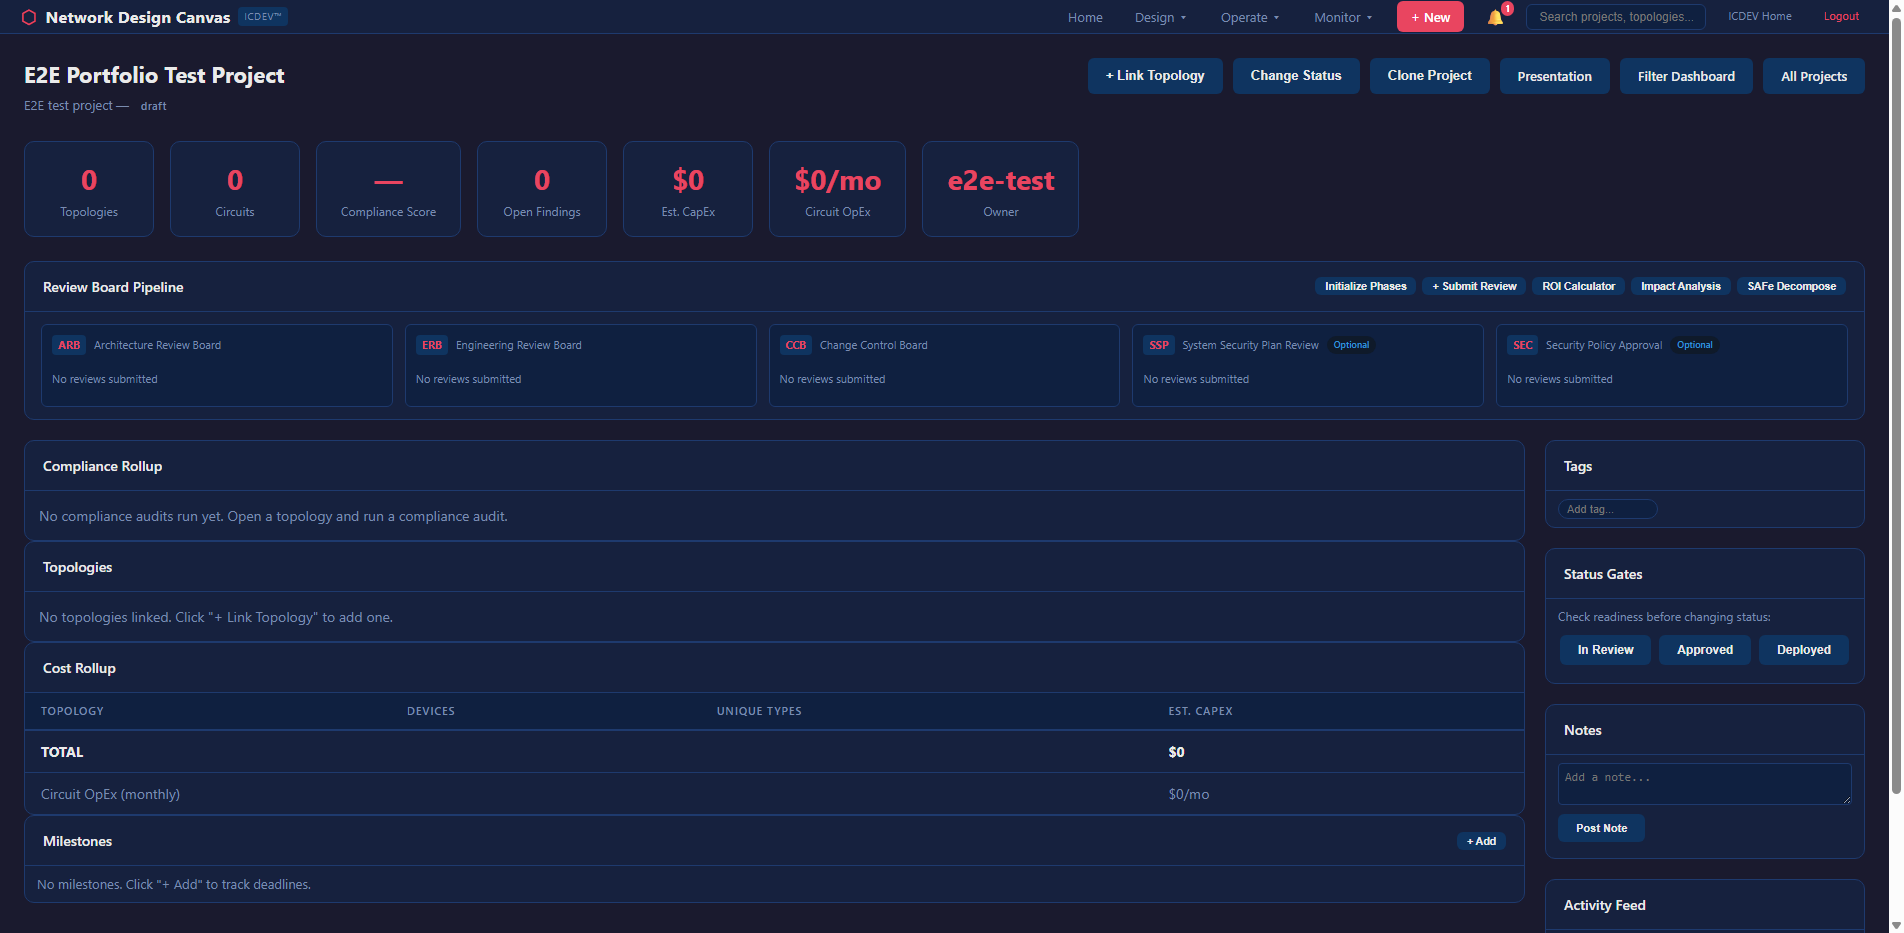
Project and Portfolio Management
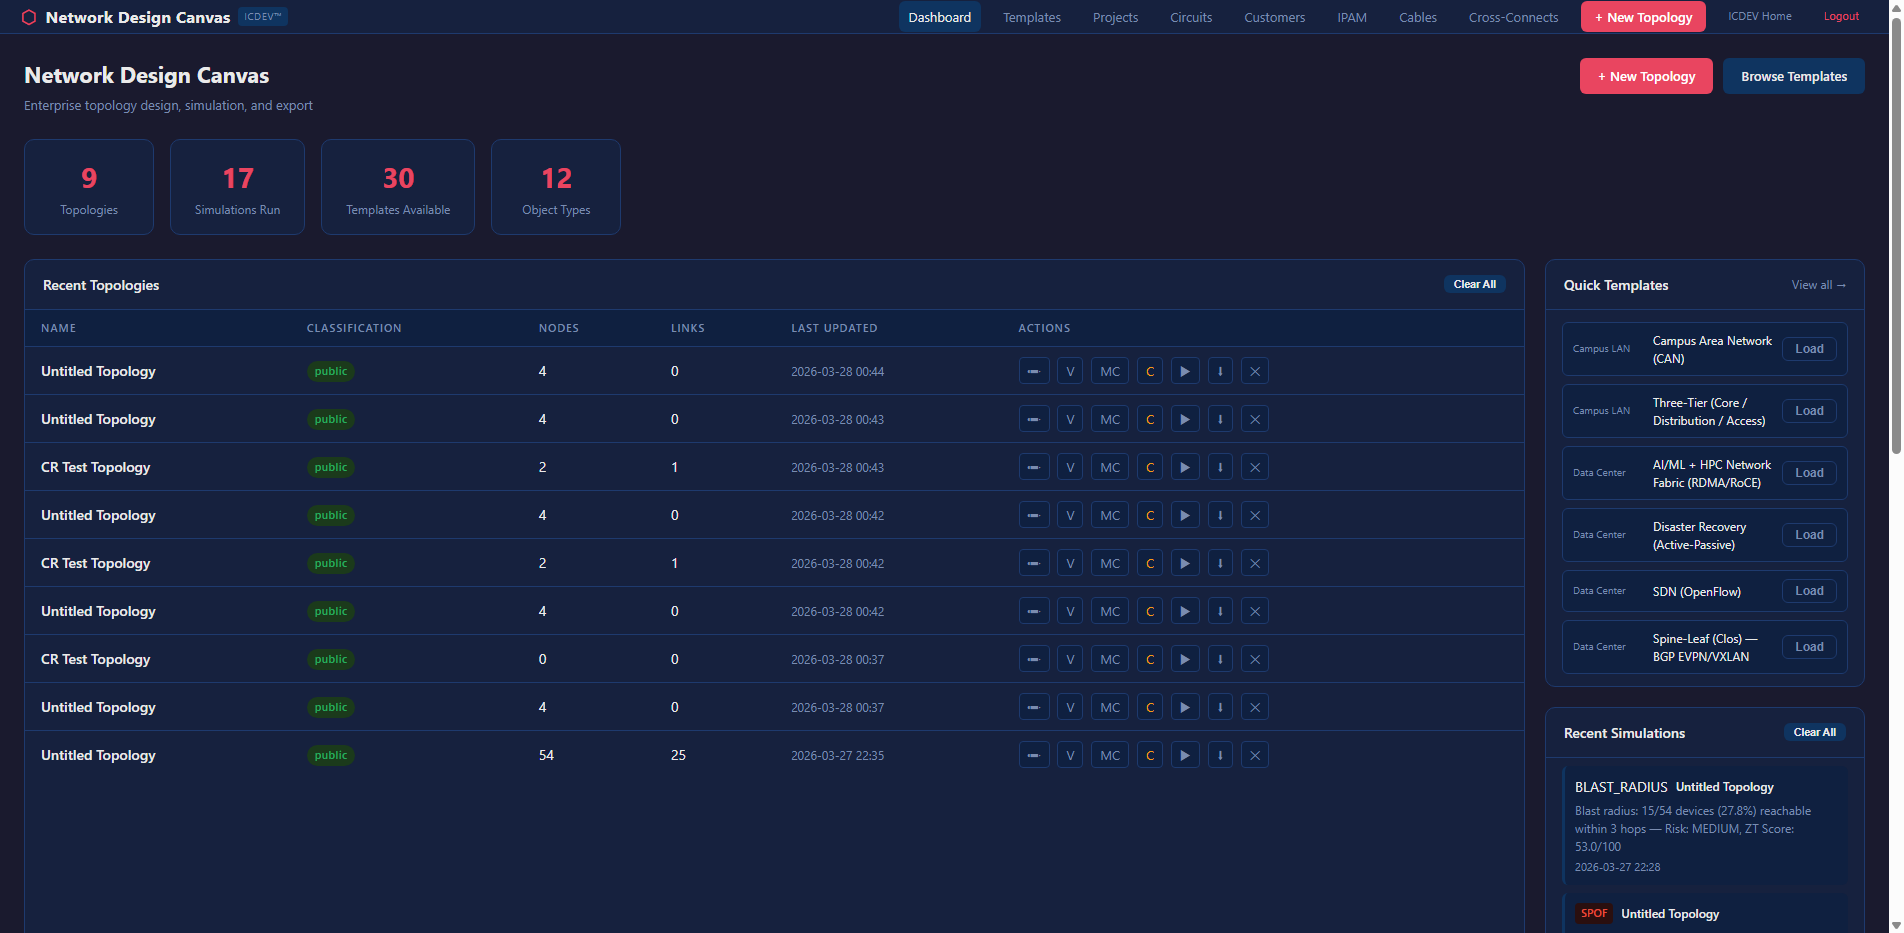
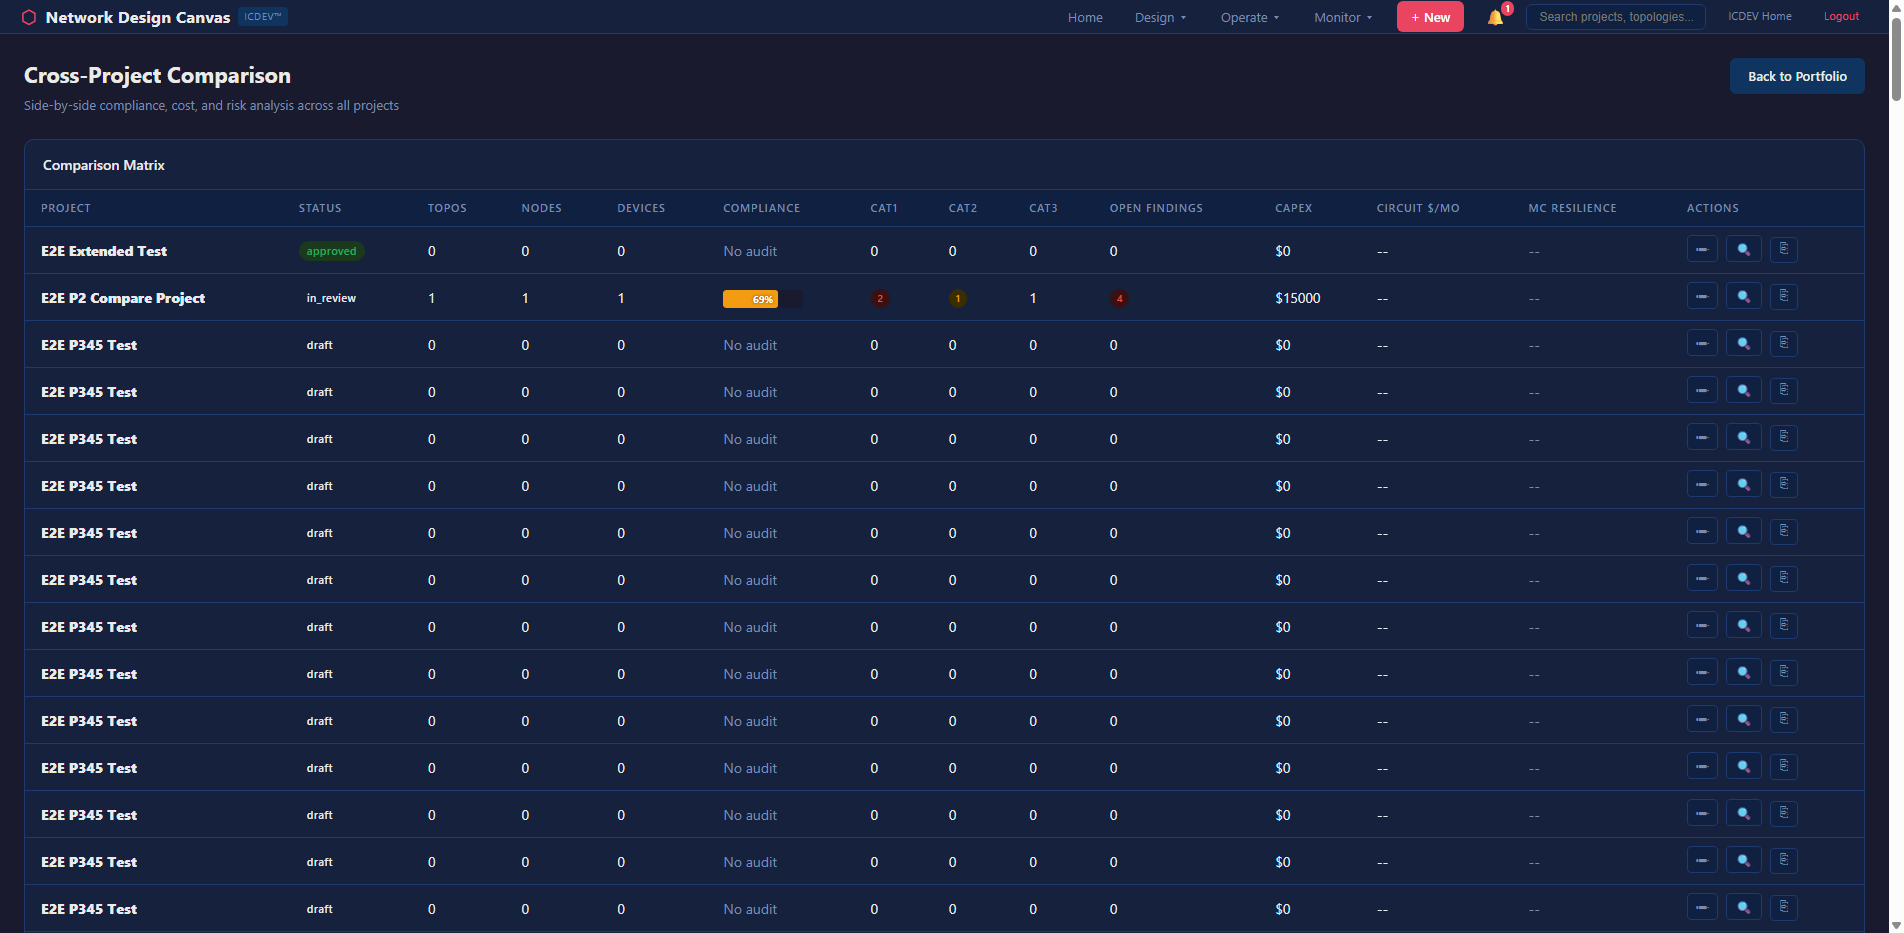
Networks don’t exist in isolation. The NDC includes project-scoped topology management — you organize designs by project, track versions, compare states over time, and manage a portfolio of network designs across your enterprise.
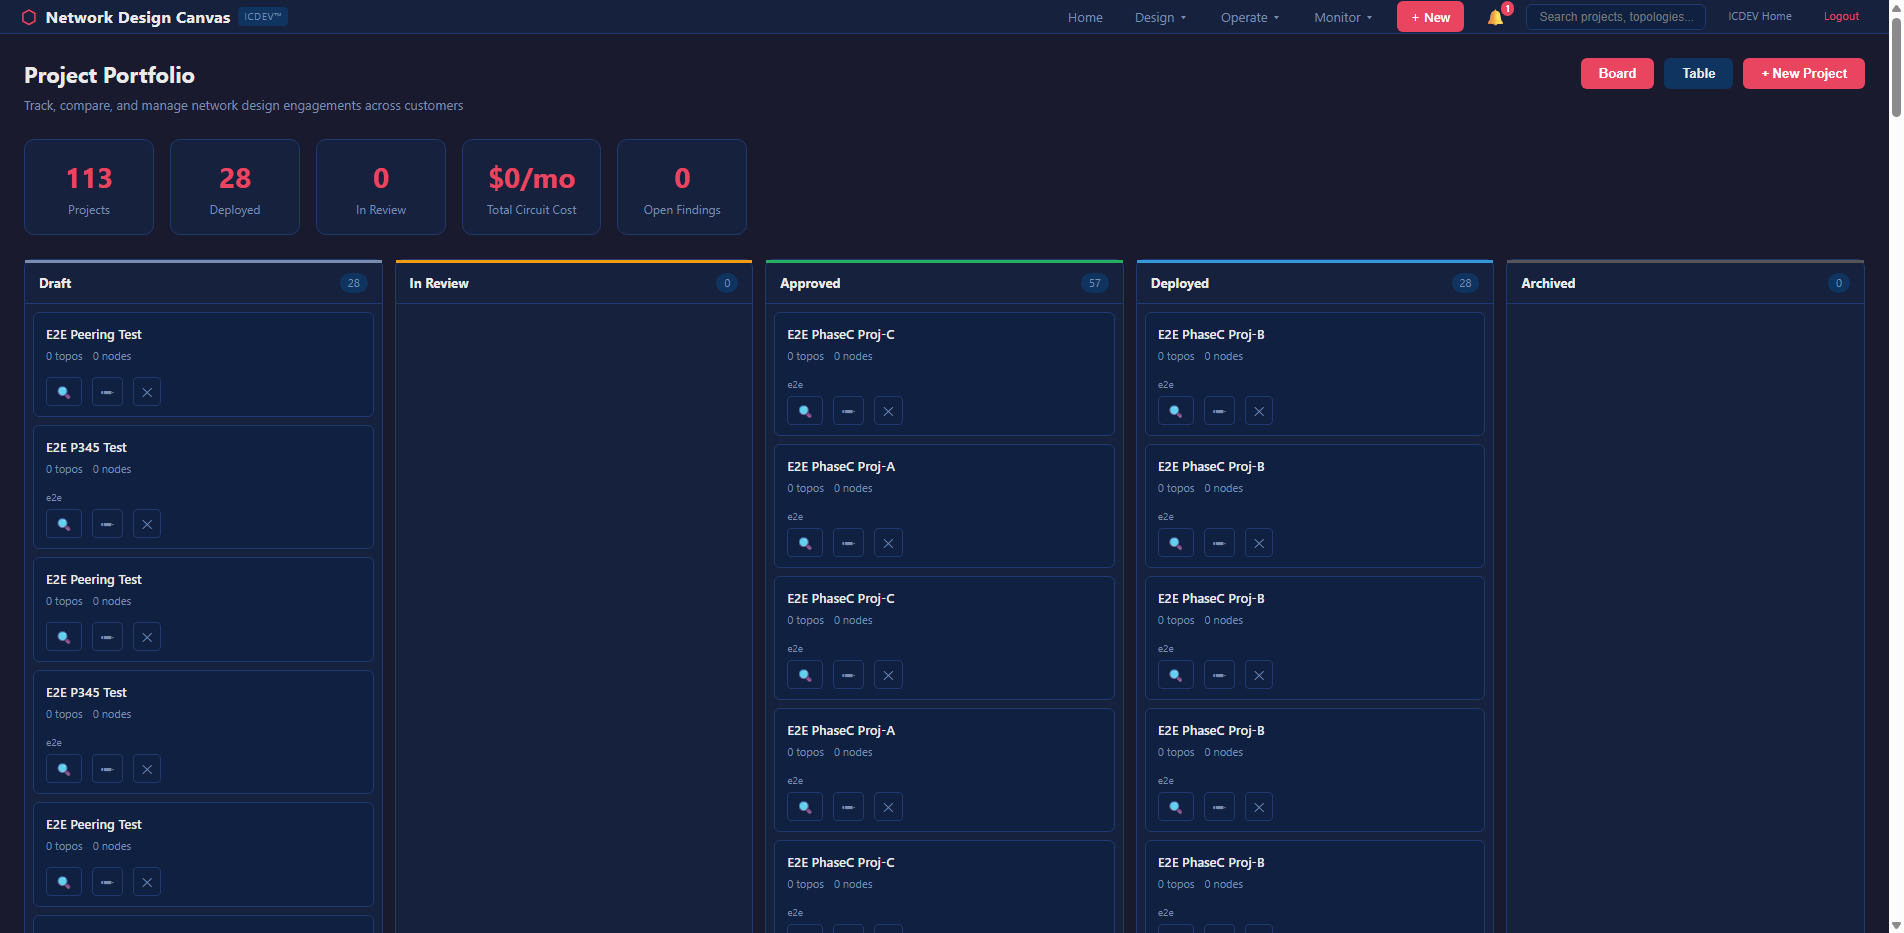
The portfolio dashboard gives you a bird’s-eye view: how many topologies per project, aggregate compliance posture, devices approaching EOL across the fleet, and overall risk scoring. It’s the view your CISO wants — not one network at a time, but the whole picture.
Version comparison lets you put two topology states side-by-side with a heatmap overlay showing what changed. Did someone add a device? Remove a link? Change an encryption setting? The diff engine catches it and flags the compliance impact.
Enterprise Integration
The NDC doesn’t ask you to abandon your existing tools. It bridges them.
NMS Adapters
Three out-of-the-box adapters for importing live topology data:
– NetBox — open-source DCIM/IPAM
– LibreNMS — open-source network monitoring
– SolarWinds — enterprise network management
Each adapter pulls device inventory, interface data, and link topology into the NDC graph. Combined with the watch folder auto-ingestion (drop a Visio file into a directory and it’s automatically imported), the NDC stays current without manual effort.
IaC Export
Every topology can be exported as:
– Ansible inventory — hosts, groups, and variables for automation playbooks
– Terraform HCL — infrastructure-as-code for cloud-managed network resources
– Device configs — Cisco IOS, Arista EOS, Juniper JunOS configs generated from the graph
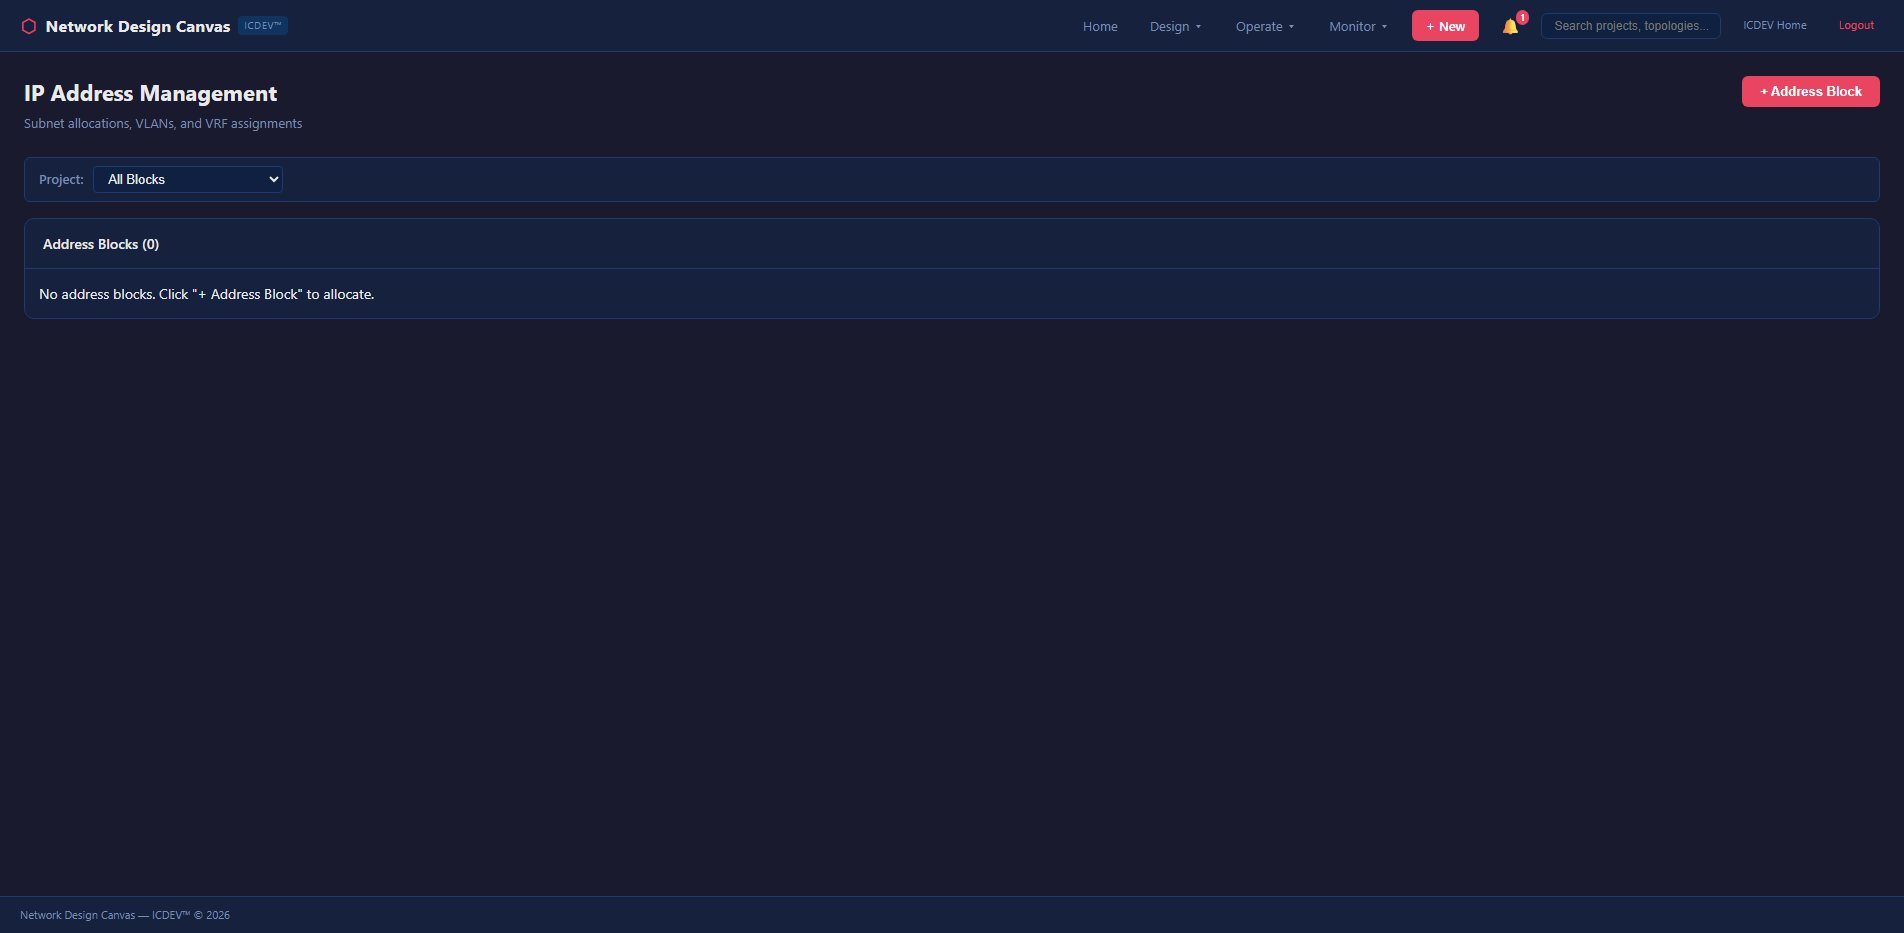
IPAM Integration
IP address management is tracked within the NDC and can sync bidirectionally with NetBox. Subnets, VLANs, and address assignments are linked to topology nodes — so when you look at a switch on the canvas, you see its management IP, its connected subnets, and its VLAN trunk configuration. Not in a separate tool. Right there on the diagram.
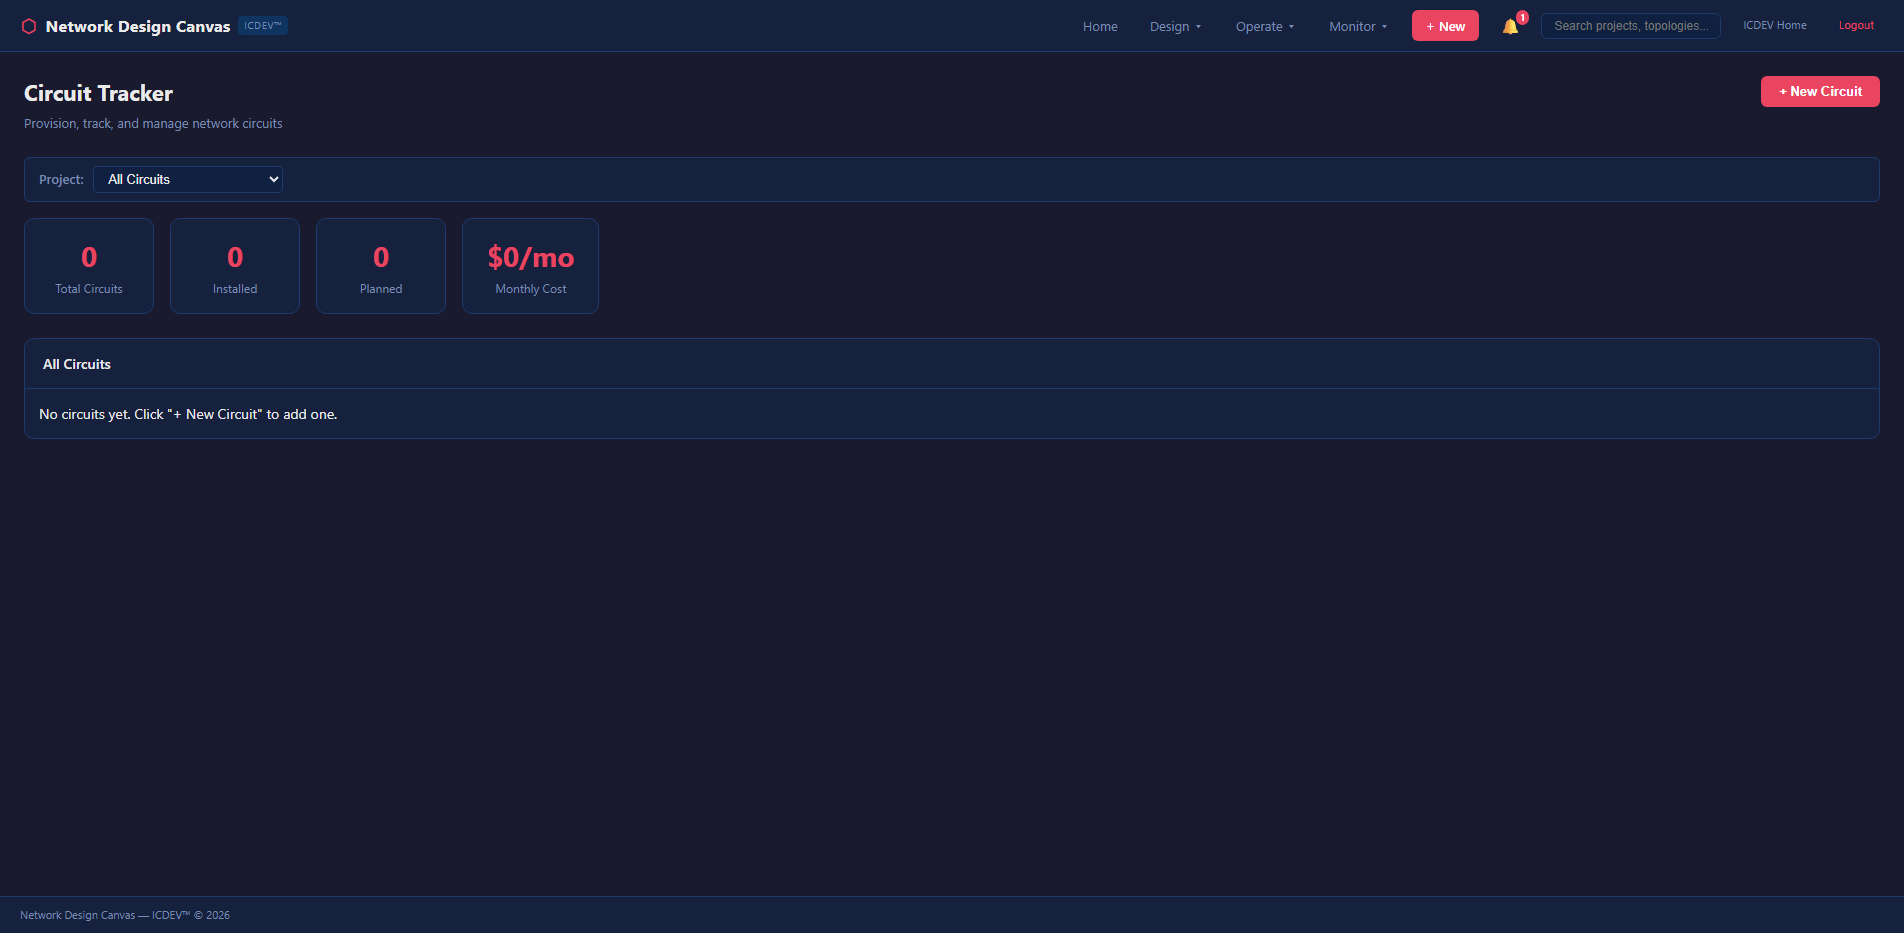
Circuit and Cable Management
Physical layer tracking that usually lives in yet another spreadsheet — if you’re lucky. More often it lives in someone’s head, and that person just retired.
The NDC manages circuit inventories, cable plant documentation, cross-connects, and carrier contract expiration — all linked to the logical topology. When a circuit contract is expiring in 90 days, the NDC flags it. When a carrier’s lead time is 12 weeks and your contract expires in 10, it flags that too. Proactive, not reactive.
Design Governance
Free-form design is how you end up with spaghetti networks. And spaghetti networks are how you end up with 3 AM pages because someone bypassed the firewall with a direct link “just for testing” that never got removed.
The NDC enforces design rules — a configurable rulebook that validates topologies against architectural standards in real time. Missing a redundant uplink on a distribution switch? The rulebook flags it with a toast notification before you save. Using a device type that’s not on the approved hardware list? Flagged. Connecting a classified enclave to an unclassified zone without an encryption device? Blocked.
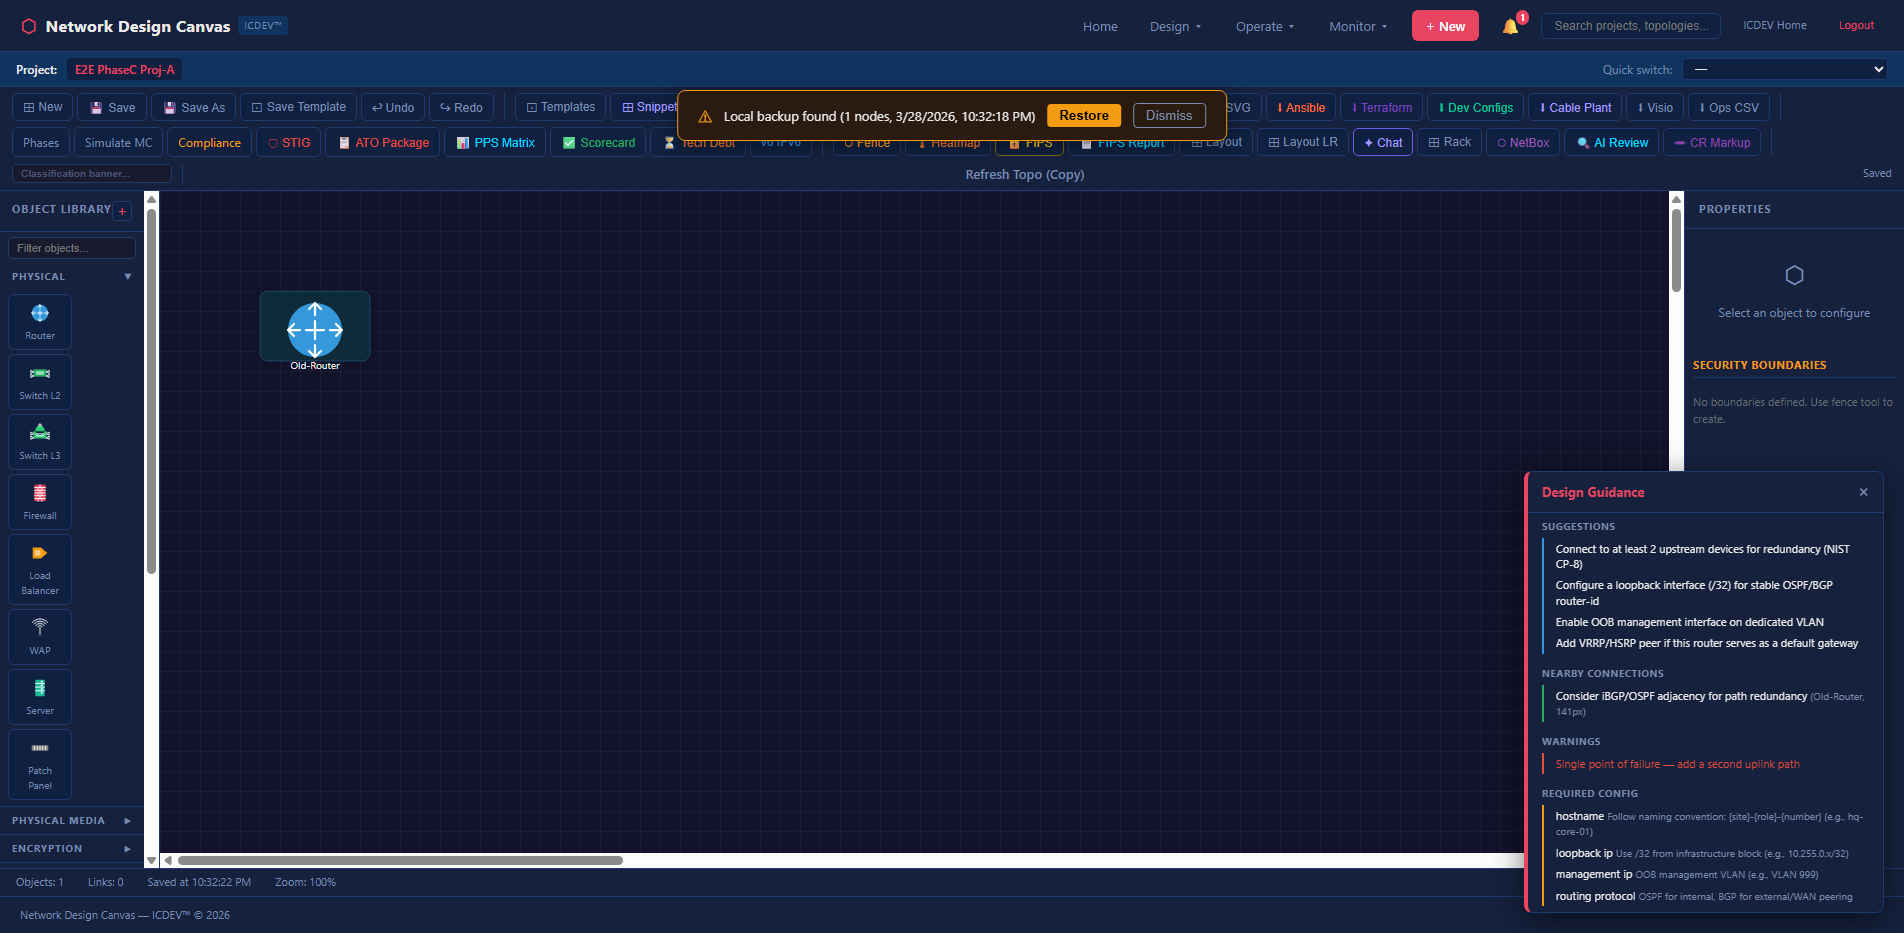
The rulebook is YAML-driven — over 10,000 tokens of architectural rules covering redundancy requirements, approved hardware profiles, security zone crossing policies, naming conventions, and bandwidth minimums. Your network architecture team defines the rules once. The canvas enforces them continuously. Engineers get real-time guidance while they design — not after they’ve already built something that fails review.
This shifts the compliance validation left. Way left. Instead of discovering that your design violates STIG requirements during the assessment phase (when changes are expensive and politically painful), the canvas catches violations while the ink is still wet on the diagram. Design-time compliance is cheaper than deployment-time remediation. Always.
FIPS Mode and Classification Handling
Federal networks require classification markings. The NDC supports FIPS-aware mode that enforces encryption validation across the topology and applies appropriate CUI/SECRET markings to exported artifacts.
When FIPS mode is enabled, the compliance engine adds FIPS 140-2/3 validation checks to every link assessment. The export engine applies classification banners to generated documents. The audit trail records every topology change with classification-appropriate markings.
What This Means in Practice
Let’s walk through a real scenario. You’re the network engineer for a DoD agency migrating a legacy on-premises enclave to AWS GovCloud. You need to design the hybrid architecture, prove it meets FISMA High requirements, and generate the automation artifacts for deployment. The ATO assessment is in six weeks. Sound familiar?
Step 1: Import existing topology. Upload the current Visio diagram. The NDC parses it into a graph with 47 nodes and 63 edges. Within seconds, you have a queryable knowledge graph — not just a picture, but a data structure you can analyze.
Step 2: Run the compliance audit. Select FISMA High + DISA STIG + Zero Trust regimes. The engine finds 12 findings: missing encryption on two internal links (SC-8 violation), no redundant path between the DMZ and the core (CP-8 gap), three devices past EOL that violate maintenance controls (MA-6), and a security zone boundary crossing without a validated encryptor (SC-13 for FIPS).
That’s twelve findings you would have discovered during the assessment — when fixing them means emergency procurement and schedule slips. Now you know before you’ve touched a single device.
Step 3: Remediate on canvas. Add the missing redundant links. Drag in a FIPS-validated encryptor snippet at the zone boundary. Enable encryption annotations on the flagged connections. Replace the EOL devices with current-generation equivalents from the approved hardware list. Re-run the audit. Findings drop to 2 — accepted risks with documented rationale that feeds directly into your POAM.
Step 4: Run Monte Carlo. 5,000 iterations. Resilience score: 94.7%. The P5 worst-case reachability is 87.3% — meaning even in a bad scenario, 87% of the network remains reachable. The engine identifies the WAN link between Building A and the cloud edge as the primary vulnerability and recommends a diverse-path secondary circuit. You add it. Resilience climbs to 97.2%.
Step 5: Generate capacity projections. The bandwidth simulator models current VDI and Teams traffic against the proposed AWS Direct Connect circuits. At 20% annual growth, the primary 10G link hits 80% utilization in 18 months. The engine recommends provisioning a second circuit or upgrading to 100G before Q2 2028.
Step 6: Export everything. Generate Ansible inventory for the on-prem devices. Terraform HCL for the AWS Transit Gateway and Direct Connect. Cisco IOS configs for the remaining on-prem routers. The compliance audit report — formatted, scored, and ready for the SSP package. Cable plant documentation for the physical team. A cost projection brief for the program manager.
Six steps. One tool. The diagram, the compliance evidence, the resilience analysis, the capacity plan, and the automation artifacts — all from the same source of truth. No spreadsheet merging. No manual cross-referencing. No praying that the Visio matches reality.
The Audit Trail
Every action on the NDC is logged to an append-only audit trail — NIST AU-compliant, immutable, timestamped. Who uploaded a diagram. Who ran a compliance audit. Who changed a device type. Who approved a change request. Who exported an Ansible playbook.
This matters for two reasons. First, your assessor can see the full history of how a topology evolved from initial design to current state. Second, when something goes wrong at 2 AM and someone asks “who changed the firewall rule last Tuesday?” — you have the answer. Immediately. Without digging through email threads or interrogating the team.
The audit trail integrates with the broader ICDEV compliance framework. Topology changes feed into the continuous ATO evidence stream. Compliance audit results become SSP supporting artifacts. The NDC isn’t a standalone tool that generates documents you manually attach to your package. It’s a live feed into your authorization evidence.
What Makes This Different
There are other network design tools. There are other compliance tools. There are other monitoring tools. What there isn’t — until now — is a single platform that connects the diagram to the analysis to the compliance evidence to the automation artifacts.
That connection is everything. When your diagram IS your compliance evidence IS your automation source IS your analysis engine, drift becomes structurally impossible. You can’t have an out-of-date diagram because the diagram is the data. You can’t have compliance evidence that doesn’t match the topology because the evidence is generated from the topology. You can’t have automation artifacts that diverge from the design because the artifacts are exported from the design.
One source of truth. Thirteen ways to analyze it. Seven compliance frameworks to audit against it. Eight export formats to operationalize it.
That’s not a diagramming tool. That’s a network intelligence platform.
Related Reading: How I Built AlphaDesk: AI Market Intelligence with ICDEV — Explore more on this topic in our article library.
Try It
The Network Design Canvas is part of ICDEV and available on GitHub. Import a diagram — any Visio, Draw.io, or PDF you have lying around. Run a compliance audit. See what your network is actually telling you once you give it a voice.
Start with one topology. Run the redundancy analysis. Look at the articulation points. Then run the Monte Carlo sim with 1,000 iterations. If the resilience score makes you uncomfortable — good. That discomfort is the first step toward a network that doesn’t just look good on paper.
The hardest part of network engineering was never the routing protocols or the firewall rules. It was knowing what you actually have. NDC solves that.